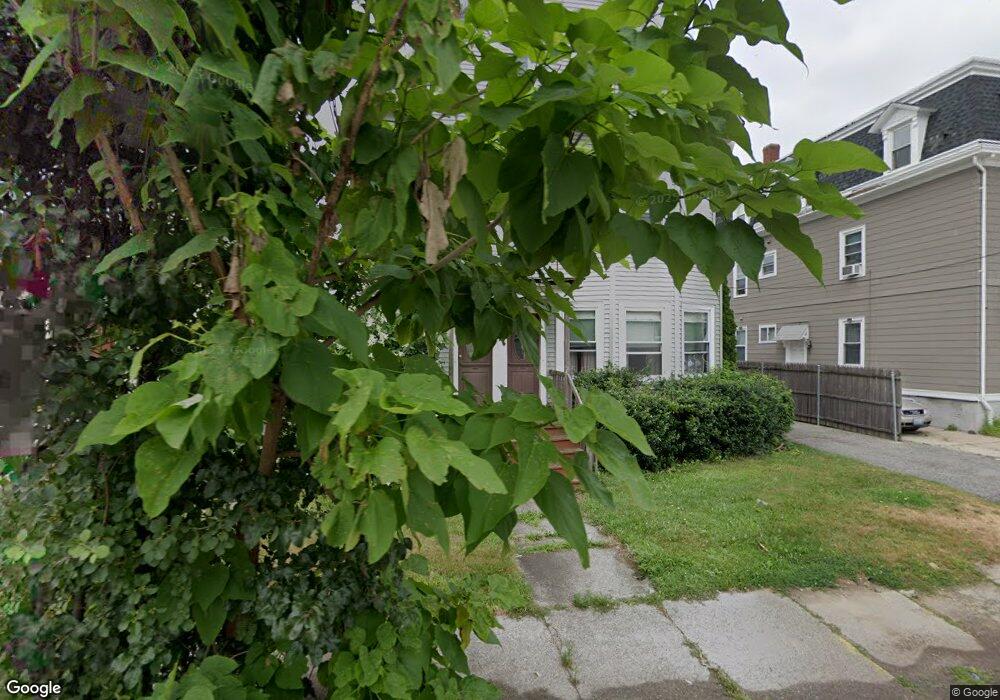
35 Myrtle St Pawtucket, RI 02860
Pleasant View NeighborhoodEstimated Value: $320,815 - $631,000
6
Beds
3
Baths
2,960
Sq Ft
$177/Sq Ft
Est. Value
About This Home
This home is located at 35 Myrtle St, Pawtucket, RI 02860 and is currently estimated at $523,204, approximately $176 per square foot. 35 Myrtle St is a home located in Providence County with nearby schools including St Cecilia School and Saint Raphael Academy.
Ownership History
Date
Name
Owned For
Owner Type
Purchase Details
Closed on
Nov 30, 2000
Sold by
Equi Max Llc
Bought by
Gaudet Armand J
Current Estimated Value
Home Financials for this Owner
Home Financials are based on the most recent Mortgage that was taken out on this home.
Original Mortgage
$90,286
Interest Rate
7.76%
Purchase Details
Closed on
Jul 19, 1988
Sold by
Petzold Alan
Bought by
Smith Shaun
Home Financials for this Owner
Home Financials are based on the most recent Mortgage that was taken out on this home.
Original Mortgage
$120,650
Interest Rate
10.57%
Create a Home Valuation Report for This Property
The Home Valuation Report is an in-depth analysis detailing your home's value as well as a comparison with similar homes in the area
Home Values in the Area
Average Home Value in this Area
Purchase History
We collect this data history from publicly available records. To have your information removed, we recommend requesting removal directly through your county’s website.
| Date | Buyer | Sale Price | Title Company |
|---|---|---|---|
| Gaudet Armand J | $92,000 | -- | |
| Smith Shaun | $127,000 | -- |
Source: Public Records
Mortgage History
We collect this data history from publicly available records. To have your information removed, we recommend requesting removal directly through your county’s website.
| Date | Status | Borrower | Loan Amount |
|---|---|---|---|
| Open | Smith Shaun | $153,000 | |
| Closed | Smith Shaun | $90,286 | |
| Previous Owner | Smith Shaun | $120,650 |
Source: Public Records
Tax History
| Year | Tax Paid | Tax Assessment Tax Assessment Total Assessment is a certain percentage of the fair market value that is determined by local assessors to be the total taxable value of land and additions on the property. | Land | Improvement |
|---|---|---|---|---|
| 2025 | $6,008 | $456,900 | $103,700 | $353,200 |
| 2024 | $5,638 | $456,900 | $103,700 | $353,200 |
| 2023 | $5,146 | $303,800 | $60,100 | $243,700 |
| 2022 | $5,037 | $303,800 | $60,100 | $243,700 |
| 2021 | $5,037 | $303,800 | $60,100 | $243,700 |
| 2020 | $4,048 | $193,800 | $50,100 | $143,700 |
| 2019 | $4,048 | $193,800 | $50,100 | $143,700 |
| 2018 | $3,901 | $193,800 | $50,100 | $143,700 |
| 2017 | $3,692 | $162,500 | $40,300 | $122,200 |
| 2016 | $3,557 | $162,500 | $40,300 | $122,200 |
| 2015 | $3,557 | $162,500 | $40,300 | $122,200 |
| 2014 | $2,774 | $120,300 | $40,300 | $80,000 |
Source: Public Records
Map
Nearby Homes
- 58 Myrtle St
- 150 N Bend St
- 87 N Bend St Unit 8
- 35 Allen Ave
- 38 Lawrence St
- 153 Central Ave
- 36 Underwood St
- 50 Primrose St
- 211 Carnation St
- 300 Front St Unit 105
- 29 Woodbine St Unit 11
- 404 Roosevelt Ave Unit 204G
- 46 Lilac St
- 256 High St
- 39 Locust St
- 208 Sabin St
- 970 York Ave
- 511 High St
- 39 Webster St Unit 101
- 517 High St
Your Personal Tour Guide
Ask me questions while you tour the home.