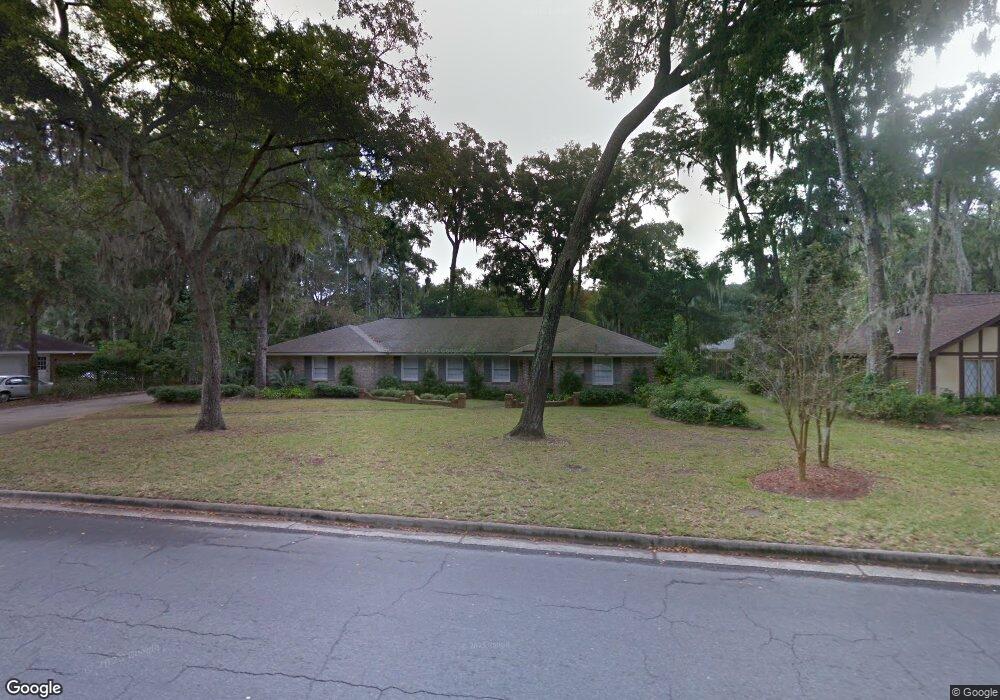
35 N Cromwell Rd Savannah, GA 31410
Estimated Value: $427,872 - $482,000
3
Beds
2
Baths
1,572
Sq Ft
$291/Sq Ft
Est. Value
About This Home
This home is located at 35 N Cromwell Rd, Savannah, GA 31410 and is currently estimated at $457,218, approximately $290 per square foot. 35 N Cromwell Rd is a home located in Chatham County with nearby schools including Howard Elementary School, Coastal Middle School, and Islands High School.
Ownership History
Date
Name
Owned For
Owner Type
Purchase Details
Closed on
Nov 17, 2020
Sold by
Mellen Peter J
Bought by
Bell Patricia E
Current Estimated Value
Home Financials for this Owner
Home Financials are based on the most recent Mortgage that was taken out on this home.
Original Mortgage
$203,440
Outstanding Balance
$179,987
Interest Rate
2.8%
Mortgage Type
New Conventional
Estimated Equity
$277,231
Create a Home Valuation Report for This Property
The Home Valuation Report is an in-depth analysis detailing your home's value as well as a comparison with similar homes in the area
Home Values in the Area
Average Home Value in this Area
Purchase History
| Date | Buyer | Sale Price | Title Company |
|---|---|---|---|
| Bell Patricia E | $254,300 | -- |
Source: Public Records
Mortgage History
| Date | Status | Borrower | Loan Amount |
|---|---|---|---|
| Open | Bell Patricia E | $203,440 |
Source: Public Records
Tax History Compared to Growth
Tax History
| Year | Tax Paid | Tax Assessment Tax Assessment Total Assessment is a certain percentage of the fair market value that is determined by local assessors to be the total taxable value of land and additions on the property. | Land | Improvement |
|---|---|---|---|---|
| 2025 | $2,634 | $124,360 | $27,720 | $96,640 |
| 2024 | $2,634 | $110,560 | $27,720 | $82,840 |
| 2023 | $1,835 | $99,560 | $27,720 | $71,840 |
| 2022 | $2,265 | $92,600 | $27,720 | $64,880 |
| 2021 | $2,637 | $77,720 | $27,720 | $50,000 |
| 2020 | $1,737 | $70,480 | $27,720 | $42,760 |
| 2019 | $1,858 | $70,480 | $27,720 | $42,760 |
| 2018 | $1,530 | $69,760 | $27,720 | $42,040 |
| 2017 | $1,504 | $64,680 | $27,720 | $36,960 |
| 2016 | $1,582 | $64,440 | $27,720 | $36,720 |
| 2015 | $1,578 | $65,840 | $27,720 | $38,120 |
| 2014 | $2,257 | $70,760 | $0 | $0 |
Source: Public Records
Map
Nearby Homes
- 127 Druid Cir
- 11 Mary Musgrove Dr
- 128 Mary Musgrove Dr
- 17 N Cromwell Rd
- 229 Island Creek Ln
- 235 Island Creek Ln
- 35 Clarendon Rd
- 209 Deerwood Rd
- 12 Cromwell Place
- 401 N Cromwell Rd Unit Q7
- 401 N Cromwell Rd Unit 2Q
- 401 N Cromwell Rd Unit F6
- 401 N Cromwell Rd Unit T-5
- 401 N Cromwell Rd Unit Q2
- 401 N Cromwell Rd Unit F-5
- 127 Penn Station
- 104 Saint Andrews Way
- 1106 Oakleaf Dr
- 710 Leaning Oaks Dr
- 1024 Walthour Rd
- 35 N Cromwell Rd
- 155 Hampshire Rd
- 33 Cromwell Place
- 37 N Cromwell Rd
- 37 N Cromwell Rd
- 37 N Cromwell Rd
- 153 Hampshire Rd
- 157 Hampshire Rd
- 34 N Cromwell Rd
- 34 N Cromwell Rd
- 36 N Cromwell Rd
- 36 N Cromwell Rd
- 31 N Cromwell Rd
- 31 Cromwell Place
- 39 N Cromwell Rd
- 39 N Cromwell Rd
- 39 N Cromwell Rd
- 151 Hampshire Rd
- 32 N Cromwell Rd
- 38 N Cromwell Rd