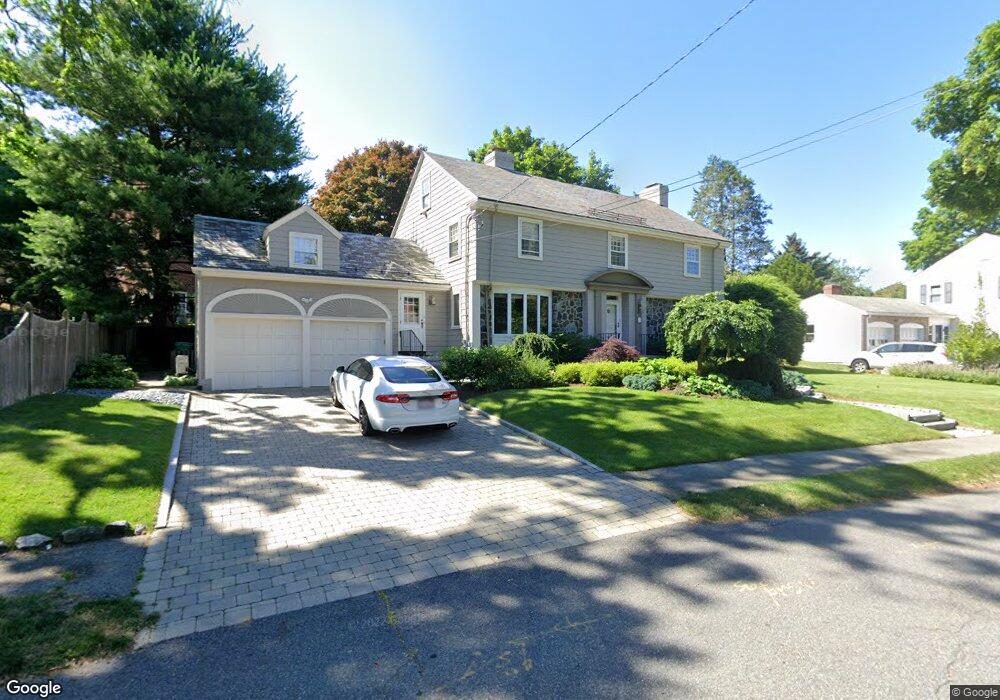
35 Oldham Rd West Newton, MA 02465
West Newton NeighborhoodEstimated Value: $2,064,000 - $2,467,000
5
Beds
4
Baths
2,790
Sq Ft
$790/Sq Ft
Est. Value
About This Home
This home is located at 35 Oldham Rd, West Newton, MA 02465 and is currently estimated at $2,203,757, approximately $789 per square foot. 35 Oldham Rd is a home located in Middlesex County with nearby schools including Peirce Elementary School, F.A. Day Middle School, and Newton North High School.
Ownership History
Date
Name
Owned For
Owner Type
Purchase Details
Closed on
Dec 7, 2023
Sold by
Simon Lee S and Simon Devra K
Bought by
Lee S Simon T- 1989 and Simon
Current Estimated Value
Purchase Details
Closed on
Nov 27, 2017
Sold by
35 Oldham Road Rt and Simon
Bought by
Simon Lee S and Simon Devra K
Home Financials for this Owner
Home Financials are based on the most recent Mortgage that was taken out on this home.
Original Mortgage
$278,700
Interest Rate
3.91%
Mortgage Type
New Conventional
Purchase Details
Closed on
Dec 27, 2010
Sold by
Simon Lee Stuart and Simon Devra Kiel
Bought by
35 Oldham Road Rt and Simon
Purchase Details
Closed on
Jul 1, 1984
Bought by
35 Oldham Rd Rt
Create a Home Valuation Report for This Property
The Home Valuation Report is an in-depth analysis detailing your home's value as well as a comparison with similar homes in the area
Home Values in the Area
Average Home Value in this Area
Purchase History
| Date | Buyer | Sale Price | Title Company |
|---|---|---|---|
| Lee S Simon T- 1989 | -- | None Available | |
| Simon Lee S | -- | -- | |
| 35 Oldham Road Rt | -- | -- | |
| 35 Oldham Rd Rt | $245,000 | -- |
Source: Public Records
Mortgage History
| Date | Status | Borrower | Loan Amount |
|---|---|---|---|
| Previous Owner | Simon Lee S | $278,700 | |
| Previous Owner | 35 Oldham Rd Rt | $336,000 | |
| Previous Owner | 35 Oldham Rd Rt | $240,000 |
Source: Public Records
Tax History Compared to Growth
Tax History
| Year | Tax Paid | Tax Assessment Tax Assessment Total Assessment is a certain percentage of the fair market value that is determined by local assessors to be the total taxable value of land and additions on the property. | Land | Improvement |
|---|---|---|---|---|
| 2025 | $19,072 | $1,946,100 | $1,103,600 | $842,500 |
| 2024 | $18,441 | $1,889,400 | $1,071,500 | $817,900 |
| 2023 | $17,764 | $1,745,000 | $820,900 | $924,100 |
| 2022 | $16,997 | $1,615,700 | $760,100 | $855,600 |
| 2021 | $5,424 | $1,524,200 | $717,100 | $807,100 |
| 2020 | $15,913 | $1,524,200 | $717,100 | $807,100 |
| 2019 | $4,620 | $1,479,800 | $696,200 | $783,600 |
| 2018 | $0 | $1,377,200 | $634,400 | $742,800 |
| 2017 | $14,447 | $1,299,200 | $598,500 | $700,700 |
| 2016 | $13,818 | $1,214,200 | $559,300 | $654,900 |
| 2015 | $13,175 | $1,134,800 | $522,700 | $612,100 |
Source: Public Records
Map
Nearby Homes
- 1639 Washington St
- 68 Mignon Rd
- 1754 Washington St
- 17 Gilbert St
- 283 Woodland Rd
- 51 Bourne St
- 163 Day St
- 10 Ruane Rd
- 0 Duncan Rd Unit 72925240
- 1488 Washington St Unit 1488
- 13 Weir St
- 179 Auburn St
- 18 Sewall St
- 194 Auburn St
- 39 Hawthorne Ave
- 17 Crescent St
- 10 Crescent St Unit 2
- 157 Stanton Ave
- 224 Auburn St Unit 224
- 226 Auburn St Unit 226
- 25 Oldham Rd
- 9 Chesterfield Rd
- 33 Chesterfield Rd
- 32 Oldham Rd
- 42 Oldham Rd
- 15 Oldham Rd
- 24 Oldham Rd
- 52 Oldham Rd
- 1669 Commonwealth Ave
- 1691 Commonwealth Ave
- 20 Chesterfield Rd
- 28 Chesterfield Rd
- 16 Chesterfield Rd
- 20 Oldham Rd
- 38 Chesterfield Rd
- 8 Chesterfield Rd
- 1701 Commonwealth Ave
- 60 Oldham Rd
- 1663 Comm Ave (On Carriage Lane)
- 1663 Commonwealth Ave