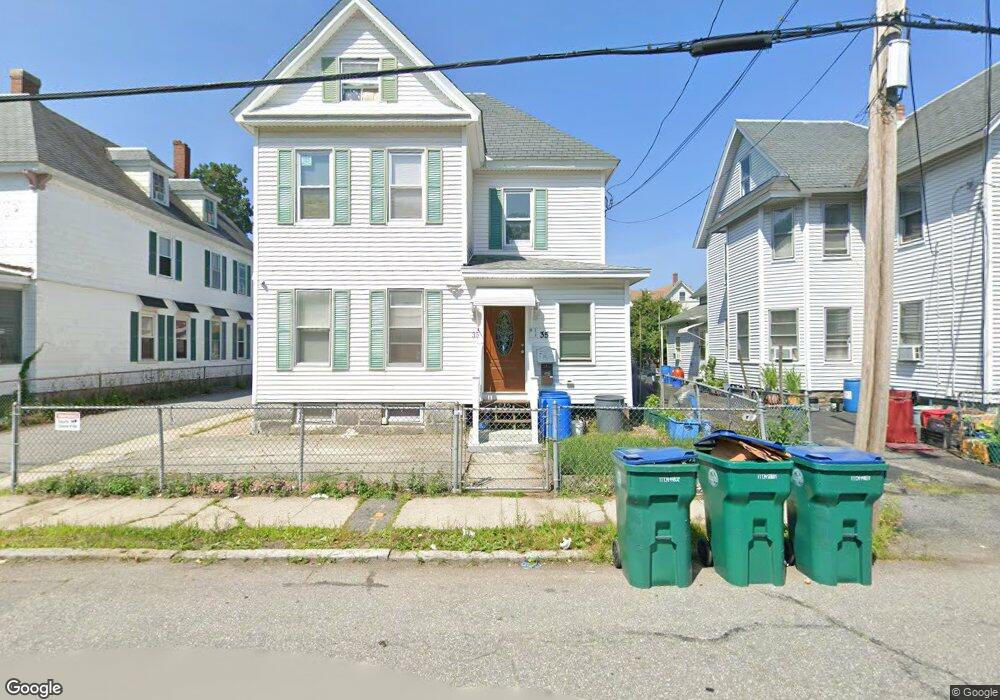
35 Osgood St Lowell, MA 01851
Lower Highlands NeighborhoodEstimated Value: $635,596 - $731,000
4
Beds
3
Baths
2,990
Sq Ft
$228/Sq Ft
Est. Value
About This Home
This home is located at 35 Osgood St, Lowell, MA 01851 and is currently estimated at $680,899, approximately $227 per square foot. 35 Osgood St is a home located in Middlesex County with nearby schools including Charles W. Morey Elementary School, Abraham Lincoln Elementary School, and Charlotte M. Murkland Elementary School.
Ownership History
Date
Name
Owned For
Owner Type
Purchase Details
Closed on
Mar 1, 2024
Sold by
Tek Vannarat and Kim Muycheng
Bought by
Tek Vannarat and Kim Muycheng
Current Estimated Value
Purchase Details
Closed on
Jan 14, 2021
Sold by
Tek Vannarat and Kim Muycheng
Bought by
Tek Vannarat and Kim Muycheng
Purchase Details
Closed on
Aug 28, 2015
Sold by
Stone Varin
Bought by
Tek Vannarat and Kim Muycheng
Purchase Details
Closed on
May 4, 2015
Sold by
Kongkaew Naowarat
Bought by
Stone Varin
Purchase Details
Closed on
Oct 15, 2012
Sold by
Stone Robert and Stone Varin
Bought by
Kongkaew Naowarat
Purchase Details
Closed on
Nov 12, 2004
Sold by
Kongkaew Naowarat and Stone Robert
Bought by
Stone Robert and Stone Varin
Purchase Details
Closed on
Aug 24, 2004
Sold by
Kongkaew Naowarat and Kongkaew Sirivan
Bought by
Kongkaew Naowarat and Stone Robert
Home Financials for this Owner
Home Financials are based on the most recent Mortgage that was taken out on this home.
Original Mortgage
$118,000
Interest Rate
6.03%
Mortgage Type
Purchase Money Mortgage
Purchase Details
Closed on
May 19, 1998
Sold by
Nget San
Bought by
Kongkaew Naowarat and Kongkaew Sirivan
Purchase Details
Closed on
Feb 18, 1994
Sold by
Raymond J Boucher Est and Siergiewicz
Bought by
Nget San
Create a Home Valuation Report for This Property
The Home Valuation Report is an in-depth analysis detailing your home's value as well as a comparison with similar homes in the area
Home Values in the Area
Average Home Value in this Area
Purchase History
| Date | Buyer | Sale Price | Title Company |
|---|---|---|---|
| Tek Vannarat | -- | None Available | |
| Tek Vannarat | -- | None Available | |
| Tek Vannarat | -- | None Available | |
| Tek Vannarat | -- | None Available | |
| Tek Vannarat | $120,000 | -- | |
| Tek Vannarat | $120,000 | -- | |
| Stone Varin | -- | -- | |
| Stone Varin | -- | -- | |
| Kongkaew Naowarat | -- | -- | |
| Kongkaew Naowarat | -- | -- | |
| Kongkaew Naowarat | -- | -- | |
| Stone Robert | -- | -- | |
| Stone Robert | -- | -- | |
| Stone Robert | -- | -- | |
| Kongkaew Naowarat | -- | -- | |
| Kongkaew Naowarat | -- | -- | |
| Kongkaew Naowarat | -- | -- | |
| Kongkaew Naowarat | $125,000 | -- | |
| Kongkaew Naowarat | $125,000 | -- | |
| Nget San | $55,000 | -- | |
| Nget San | $55,000 | -- |
Source: Public Records
Mortgage History
| Date | Status | Borrower | Loan Amount |
|---|---|---|---|
| Previous Owner | Kongkaew Naowarat | $118,000 |
Source: Public Records
Tax History
| Year | Tax Paid | Tax Assessment Tax Assessment Total Assessment is a certain percentage of the fair market value that is determined by local assessors to be the total taxable value of land and additions on the property. | Land | Improvement |
|---|---|---|---|---|
| 2025 | $6,963 | $606,500 | $166,200 | $440,300 |
| 2024 | $6,416 | $538,700 | $149,500 | $389,200 |
| 2023 | $5,960 | $479,900 | $130,000 | $349,900 |
| 2022 | $5,516 | $434,700 | $118,200 | $316,500 |
| 2021 | $5,115 | $380,000 | $102,800 | $277,200 |
| 2020 | $4,613 | $345,300 | $89,800 | $255,500 |
| 2019 | $4,244 | $302,300 | $83,200 | $219,100 |
| 2018 | $3,914 | $272,000 | $75,800 | $196,200 |
| 2017 | $3,700 | $248,000 | $68,900 | $179,100 |
| 2016 | $3,685 | $243,100 | $65,600 | $177,500 |
| 2015 | $3,435 | $221,900 | $67,100 | $154,800 |
| 2013 | $3,185 | $212,200 | $80,300 | $131,900 |
Source: Public Records
Map
Nearby Homes
- 30 Grace St
- 18 Burgess St
- 67 S Loring St
- 11 Warwick St Unit 3
- 710 School St
- 3 Butman Place
- 137 Pine St Unit 11
- 15 Barclay St
- 68 Smith St
- 85 B St
- 312 Wilder St
- 42 Branch St
- 143 Westford St
- 1017 Middlesex St Unit 5
- 23 Burtt St
- 17 Edson St
- 186 Powell St
- 64 Bradstreet Ave
- 45 Marshall St
- 45 Harvard St Unit 5 3rd fl
Your Personal Tour Guide
Ask me questions while you tour the home.