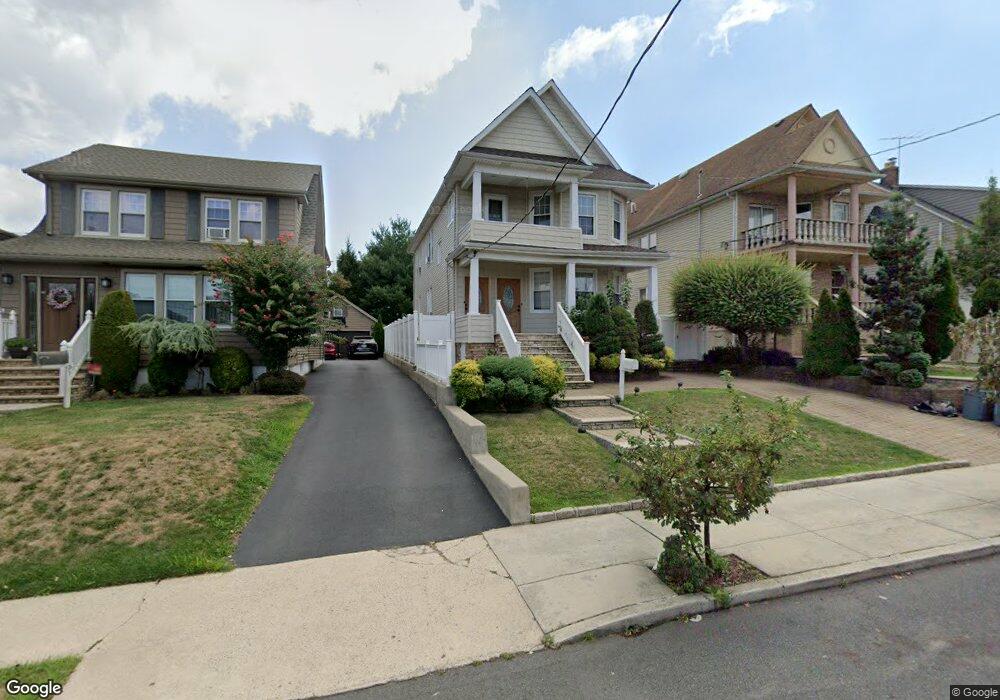
35 Perry Ave Staten Island, NY 10314
Westerleigh NeighborhoodEstimated Value: $950,000 - $1,120,000
5
Beds
2
Baths
2,970
Sq Ft
$350/Sq Ft
Est. Value
About This Home
This home is located at 35 Perry Ave, Staten Island, NY 10314 and is currently estimated at $1,039,979, approximately $350 per square foot. 35 Perry Ave is a home located in Richmond County with nearby schools including P.S. 54 Charles W Leng, Is 72 Rocco Laurie, and Susan E Wagner High School.
Ownership History
Date
Name
Owned For
Owner Type
Purchase Details
Closed on
May 14, 2004
Sold by
Arpaia Michael
Bought by
Pritchett Michael and Pritchett Judith
Current Estimated Value
Home Financials for this Owner
Home Financials are based on the most recent Mortgage that was taken out on this home.
Original Mortgage
$484,500
Interest Rate
5.88%
Mortgage Type
Purchase Money Mortgage
Purchase Details
Closed on
Feb 5, 2004
Sold by
Wyso Peter Jon and Wyso Brent
Bought by
Arpaia Michael
Create a Home Valuation Report for This Property
The Home Valuation Report is an in-depth analysis detailing your home's value as well as a comparison with similar homes in the area
Home Values in the Area
Average Home Value in this Area
Purchase History
| Date | Buyer | Sale Price | Title Company |
|---|---|---|---|
| Pritchett Michael | $510,000 | Homestead Title Agency Inc | |
| Arpaia Michael | $325,000 | Homestead Title Agency Inc |
Source: Public Records
Mortgage History
| Date | Status | Borrower | Loan Amount |
|---|---|---|---|
| Previous Owner | Pritchett Michael | $484,500 |
Source: Public Records
Tax History Compared to Growth
Tax History
| Year | Tax Paid | Tax Assessment Tax Assessment Total Assessment is a certain percentage of the fair market value that is determined by local assessors to be the total taxable value of land and additions on the property. | Land | Improvement |
|---|---|---|---|---|
| 2025 | $7,716 | $53,400 | $10,805 | $42,595 |
| 2024 | $7,716 | $43,620 | $13,158 | $30,462 |
| 2023 | $7,393 | $36,809 | $10,670 | $26,139 |
| 2022 | $6,932 | $50,460 | $14,940 | $35,520 |
| 2021 | $6,894 | $41,760 | $14,940 | $26,820 |
| 2020 | $6,812 | $42,240 | $14,940 | $27,300 |
| 2019 | $6,697 | $45,840 | $14,940 | $30,900 |
| 2018 | $6,253 | $30,674 | $14,066 | $16,608 |
| 2017 | $5,899 | $28,938 | $14,498 | $14,440 |
| 2016 | $5,458 | $27,300 | $14,940 | $12,360 |
| 2015 | $5,120 | $26,820 | $16,140 | $10,680 |
| 2014 | $5,120 | $26,679 | $15,045 | $11,634 |
Source: Public Records
Map
Nearby Homes
- 85 Perry Ave
- 144 Purdy Ave
- 105 Perry Ave
- 86 Clermont Place
- 60-A Perry Ave
- 2111 Victory Blvd
- 127 Bradley Ave
- 179 Mann Ave
- 74 Kell Ave
- 170 Mann Ave
- 25 Coale Ave
- 497 Ingram Ave
- 125 N Gannon Ave
- 63 Avon Ln
- 181 Perry Ave
- 307 Fiske Ave
- 307 Clinton B Fiske Ave
- 267 Purdy Ave
- 31 Ramsey Ln
- 83 N Gannon Ave Unit A