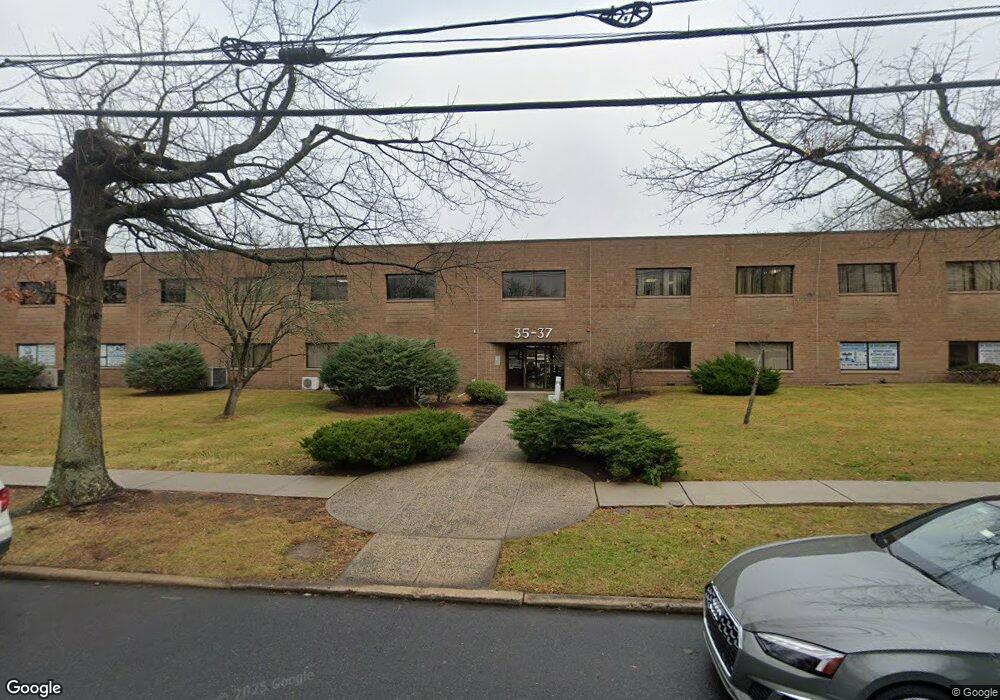
35 Progress St Unit B3 Edison, NJ 08820
Estimated Value: $357,789 - $603,000
Studio
--
Bath
516
Sq Ft
$931/Sq Ft
Est. Value
About This Home
This home is located at 35 Progress St Unit B3, Edison, NJ 08820 and is currently estimated at $480,395, approximately $930 per square foot. 35 Progress St Unit B3 is a home located in Middlesex County with nearby schools including Martin Luther King Elementary School, John Adams Middle School, and J.P. Stevens High School.
Ownership History
Date
Name
Owned For
Owner Type
Purchase Details
Closed on
Feb 1, 2022
Sold by
Sandhu Navdeep Kaur
Bought by
Navdeep Kaur Sandhu Trust
Current Estimated Value
Purchase Details
Closed on
Dec 20, 2021
Sold by
Shivreha Holdings Limited Liability Comp
Bought by
Harpoon Investments Llc
Purchase Details
Closed on
Feb 18, 2009
Sold by
Sullivan Edgar J and Sullivan Bessie M
Bought by
Sandhu Navdeep Kaur
Purchase Details
Closed on
Sep 27, 1999
Sold by
Bussel Steven
Bought by
Kumar Mahesh
Home Financials for this Owner
Home Financials are based on the most recent Mortgage that was taken out on this home.
Original Mortgage
$150,000
Interest Rate
7.8%
Purchase Details
Closed on
Dec 14, 1993
Sold by
The Estate Of Michael Prepon
Bought by
Sullivan Edgar and Sullivan Bessie
Home Financials for this Owner
Home Financials are based on the most recent Mortgage that was taken out on this home.
Original Mortgage
$210,000
Interest Rate
6.78%
Create a Home Valuation Report for This Property
The Home Valuation Report is an in-depth analysis detailing your home's value as well as a comparison with similar homes in the area
Home Values in the Area
Average Home Value in this Area
Purchase History
| Date | Buyer | Sale Price | Title Company |
|---|---|---|---|
| Navdeep Kaur Sandhu Trust | -- | -- | |
| Harpoon Investments Llc | $412,500 | Prestige Title | |
| Sandhu Navdeep Kaur | $92,000 | Stewart Title Guaranty Co | |
| Kumar Mahesh | $190,000 | -- | |
| Sullivan Edgar | $300,000 | -- |
Source: Public Records
Mortgage History
| Date | Status | Borrower | Loan Amount |
|---|---|---|---|
| Previous Owner | Kumar Mahesh | $150,000 | |
| Previous Owner | Sullivan Edgar | $210,000 |
Source: Public Records
Tax History
| Year | Tax Paid | Tax Assessment Tax Assessment Total Assessment is a certain percentage of the fair market value that is determined by local assessors to be the total taxable value of land and additions on the property. | Land | Improvement |
|---|---|---|---|---|
| 2025 | $3,381 | $56,800 | $12,900 | $43,900 |
| 2024 | $3,363 | $56,800 | $12,900 | $43,900 |
| 2023 | $3,363 | $56,800 | $12,900 | $43,900 |
| 2022 | $3,364 | $56,800 | $12,900 | $43,900 |
| 2021 | $3,228 | $56,800 | $12,900 | $43,900 |
| 2020 | $3,197 | $56,800 | $12,900 | $43,900 |
| 2019 | $3,072 | $56,800 | $12,900 | $43,900 |
| 2018 | $2,929 | $56,800 | $12,900 | $43,900 |
| 2017 | $2,929 | $56,800 | $12,900 | $43,900 |
| 2016 | $2,872 | $56,800 | $12,900 | $43,900 |
| 2015 | $2,763 | $56,800 | $12,900 | $43,900 |
| 2014 | $2,684 | $56,800 | $12,900 | $43,900 |
Source: Public Records
Map
Nearby Homes
- 990 Inman Ave
- 5 Lily Ct
- 6 Tulip Ct
- 29 Westgate Dr Unit 29
- 265 W Prescott Ave
- 16 Moyse Place
- 34 Stratford Cir
- 303 Maplecrest Rd
- 304 Maplecrest Rd Unit 4
- 868 Inman Ave
- 244 W Prescott Ave
- 973 Ellis Pkwy
- 1704 Deerfield Dr
- 275 Alden Ave
- 3606 Spring Brook Dr
- 5001 Stonehedge Rd Unit 5001
- 40 Linda Ln
- 77 Linda Ln
- 3606 Springbrook Dr
- 3 Old Hickory Ln
- 37 Progress St Unit A2
- 37 Progress St Unit A5
- 37 Progress St Unit B1
- 37 Progress St Unit AA5
- 37 Progress St Unit A6
- 37 Progress St Unit A4
- 37 Progress St Unit A3
- 37 Progress St Unit A1
- 37 Progress St Unit B6
- 37 Progress St Unit B5
- 35-37 Progress St Unit B5
- 35-37 Progress St
- 37 Progress St Unit B-3
- 35-37 Progress St Unit B1
- 35 Progress St Unit 1
- 35 Progress St Unit 5
- 35 Progress St Unit 6
- 35 Progress St Unit B1
- 35 Progress St
- 36 Progress St Unit B5
Your Personal Tour Guide
Ask me questions while you tour the home.