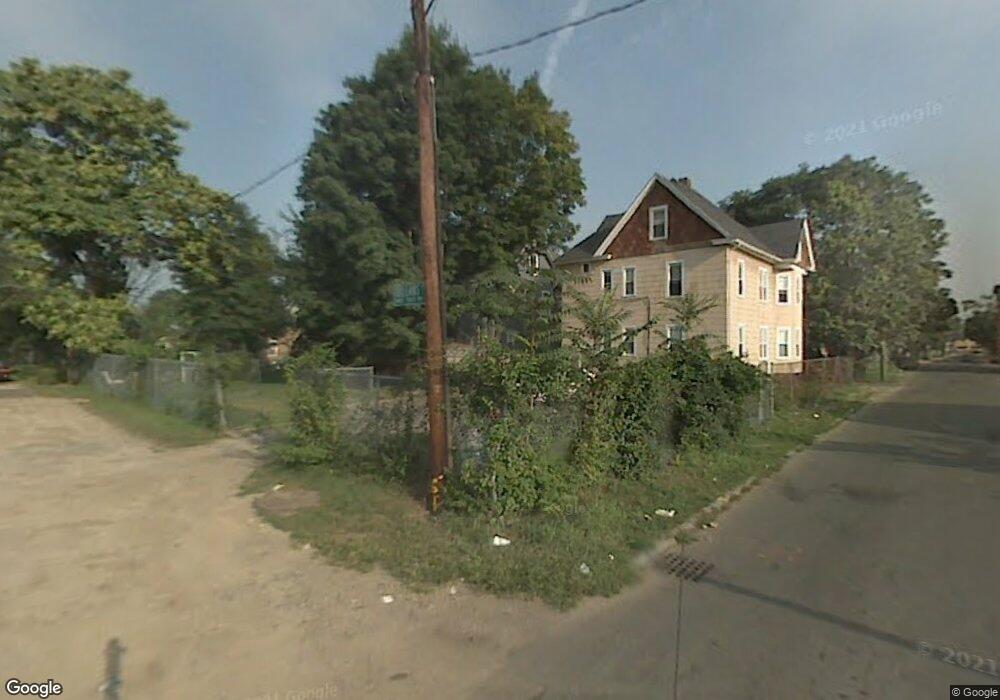
35 Quincy St Springfield, MA 01109
Old Hill NeighborhoodEstimated Value: $256,000 - $324,000
5
Beds
3
Baths
2,806
Sq Ft
$101/Sq Ft
Est. Value
About This Home
This home is located at 35 Quincy St, Springfield, MA 01109 and is currently estimated at $282,760, approximately $100 per square foot. 35 Quincy St is a home located in Hampden County with nearby schools including William N. DeBerry Elementary School, M Marcus Kiley Middle, and High School Of Commerce.
Ownership History
Date
Name
Owned For
Owner Type
Purchase Details
Closed on
Dec 13, 2019
Sold by
Anhs Inc
Bought by
Green Apple Manor Props
Current Estimated Value
Purchase Details
Closed on
Oct 3, 2011
Sold by
Ardolino Chester
Bought by
Anhs Inc
Purchase Details
Closed on
Apr 3, 2009
Sold by
Karanja Lucy W and Bank Of New York
Bought by
Bank Of New York
Purchase Details
Closed on
Oct 7, 2005
Sold by
Allen-Glenn Andrea and Glenn Lonnie
Bought by
Karanja Lucy W
Home Financials for this Owner
Home Financials are based on the most recent Mortgage that was taken out on this home.
Original Mortgage
$140,000
Interest Rate
5.81%
Mortgage Type
Purchase Money Mortgage
Create a Home Valuation Report for This Property
The Home Valuation Report is an in-depth analysis detailing your home's value as well as a comparison with similar homes in the area
Home Values in the Area
Average Home Value in this Area
Purchase History
| Date | Buyer | Sale Price | Title Company |
|---|---|---|---|
| Green Apple Manor Props | $150,000 | None Available | |
| Anhs Inc | $25,000 | -- | |
| Anhs Inc | $25,000 | -- | |
| Ardolino Chester | $19,000 | -- | |
| Bank Of New York | $163,186 | -- | |
| Bank Of New York | $163,186 | -- | |
| Bank Of New York | $163,186 | -- | |
| Karanja Lucy W | $175,000 | -- | |
| Karanja Lucy W | $175,000 | -- |
Source: Public Records
Mortgage History
| Date | Status | Borrower | Loan Amount |
|---|---|---|---|
| Previous Owner | Karanja Lucy W | $140,000 | |
| Previous Owner | Karanja Lucy W | $35,000 | |
| Previous Owner | Karanja Lucy W | $1,300 |
Source: Public Records
Tax History
| Year | Tax Paid | Tax Assessment Tax Assessment Total Assessment is a certain percentage of the fair market value that is determined by local assessors to be the total taxable value of land and additions on the property. | Land | Improvement |
|---|---|---|---|---|
| 2025 | $2,581 | $164,600 | $23,000 | $141,600 |
| 2024 | $2,491 | $155,100 | $21,500 | $133,600 |
| 2023 | $2,416 | $141,700 | $20,500 | $121,200 |
| 2022 | $2,625 | $139,500 | $18,600 | $120,900 |
| 2021 | $2,567 | $135,800 | $16,900 | $118,900 |
| 2020 | $1,957 | $100,200 | $16,900 | $83,300 |
| 2019 | $1,887 | $95,900 | $16,900 | $79,000 |
| 2018 | $1,750 | $88,900 | $16,900 | $72,000 |
| 2017 | $1,752 | $89,100 | $13,500 | $75,600 |
| 2016 | $1,557 | $79,200 | $13,500 | $65,700 |
| 2015 | $1,308 | $66,500 | $13,500 | $53,000 |
Source: Public Records
Map
Nearby Homes
- 33 Quincy St Unit 1
- 35 Quincy St Unit 2
- 33 Quincy St
- 39 Quincy St
- 23 Quincy St
- 30 Quincy St Unit 2
- 30 Quincy St Unit 1
- 30 Quincy St
- 34 Quincy St Unit 1
- 24 Quincy St Unit 26
- 24-26 Quincy St
- 91 Orleans St
- 13 Orleans Ct
- 93 Orleans St Unit 93
- 97 Orleans St Unit 97
- 18 Quincy St Unit 22
- 101 Orleans St Unit 2
- 101 Orleans St Unit 101
- 99 Orleans St
- 38 Tyler St
Your Personal Tour Guide
Ask me questions while you tour the home.