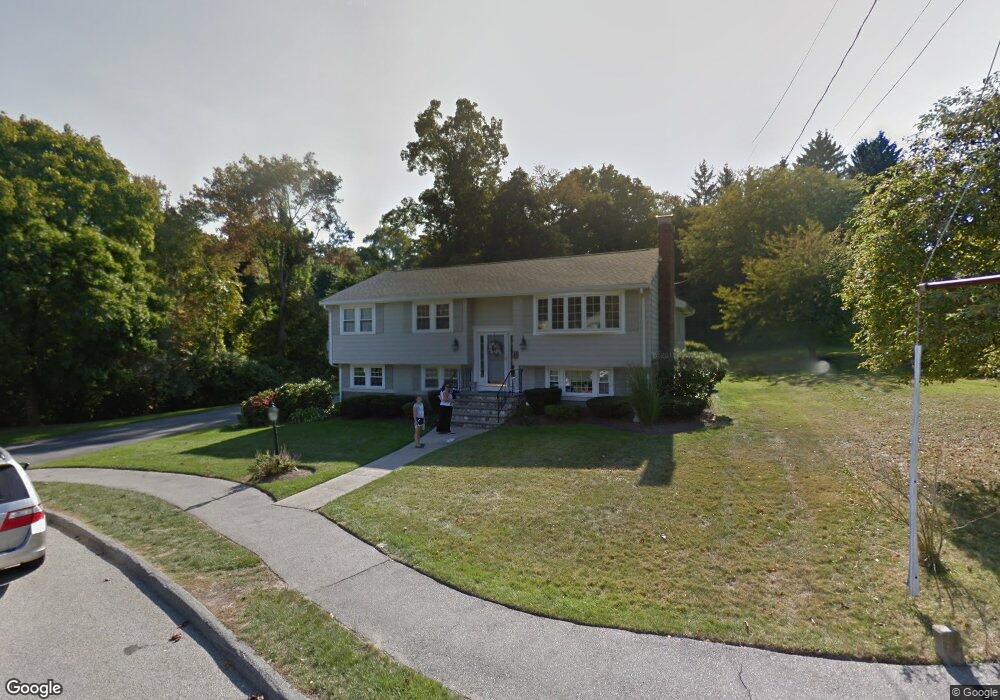
35 Rogers Cir Braintree, MA 02184
East Braintree NeighborhoodEstimated Value: $694,000 - $759,000
3
Beds
2
Baths
1,891
Sq Ft
$382/Sq Ft
Est. Value
About This Home
This home is located at 35 Rogers Cir, Braintree, MA 02184 and is currently estimated at $723,303, approximately $382 per square foot. 35 Rogers Cir is a home located in Norfolk County with nearby schools including Braintree High School, Meeting House Montessori School, and Step Ahead Kindergarten.
Ownership History
Date
Name
Owned For
Owner Type
Purchase Details
Closed on
Jan 12, 2007
Sold by
Dona M Centofanti T
Bought by
Giannandrea Jeneen and Giannandrea Rodolfo
Current Estimated Value
Create a Home Valuation Report for This Property
The Home Valuation Report is an in-depth analysis detailing your home's value as well as a comparison with similar homes in the area
Home Values in the Area
Average Home Value in this Area
Purchase History
| Date | Buyer | Sale Price | Title Company |
|---|---|---|---|
| Giannandrea Jeneen | $350,000 | -- |
Source: Public Records
Tax History
| Year | Tax Paid | Tax Assessment Tax Assessment Total Assessment is a certain percentage of the fair market value that is determined by local assessors to be the total taxable value of land and additions on the property. | Land | Improvement |
|---|---|---|---|---|
| 2025 | $6,965 | $697,900 | $400,900 | $297,000 |
| 2024 | $6,197 | $653,700 | $369,300 | $284,400 |
| 2023 | $5,915 | $606,000 | $337,600 | $268,400 |
| 2022 | $5,610 | $563,800 | $295,400 | $268,400 |
| 2021 | $5,246 | $527,200 | $266,900 | $260,300 |
| 2020 | $4,960 | $503,000 | $242,700 | $260,300 |
| 2019 | $4,884 | $484,000 | $242,700 | $241,300 |
| 2018 | $4,663 | $442,400 | $211,000 | $231,400 |
| 2017 | $4,516 | $420,500 | $200,500 | $220,000 |
| 2016 | $4,429 | $403,400 | $189,900 | $213,500 |
| 2015 | $4,230 | $382,100 | $185,700 | $196,400 |
| 2014 | $3,838 | $336,100 | $161,400 | $174,700 |
Source: Public Records
Map
Nearby Homes
- 342 Elm St
- 17 White Rd
- 26 Tingley Rd
- 255 River St
- 30 Skyline Dr Unit 6
- 20 Vine St
- 37 Skyline Dr Unit 11
- 25 W Howard St Unit C3
- 9 Independence Ave Unit 307
- 192 Federal Ave Unit B
- 155 Kendrick Ave Unit 502
- 99 Verchild St
- 312 Shaw St
- 200 Falls Blvd Unit E101
- 200 Falls Blvd Unit B305
- 200 Falls Blvd Unit I301
- 300 Commercial St Unit 23
- 166 Phipps St
- 177 Franklin St
- 599 Union St
Your Personal Tour Guide
Ask me questions while you tour the home.