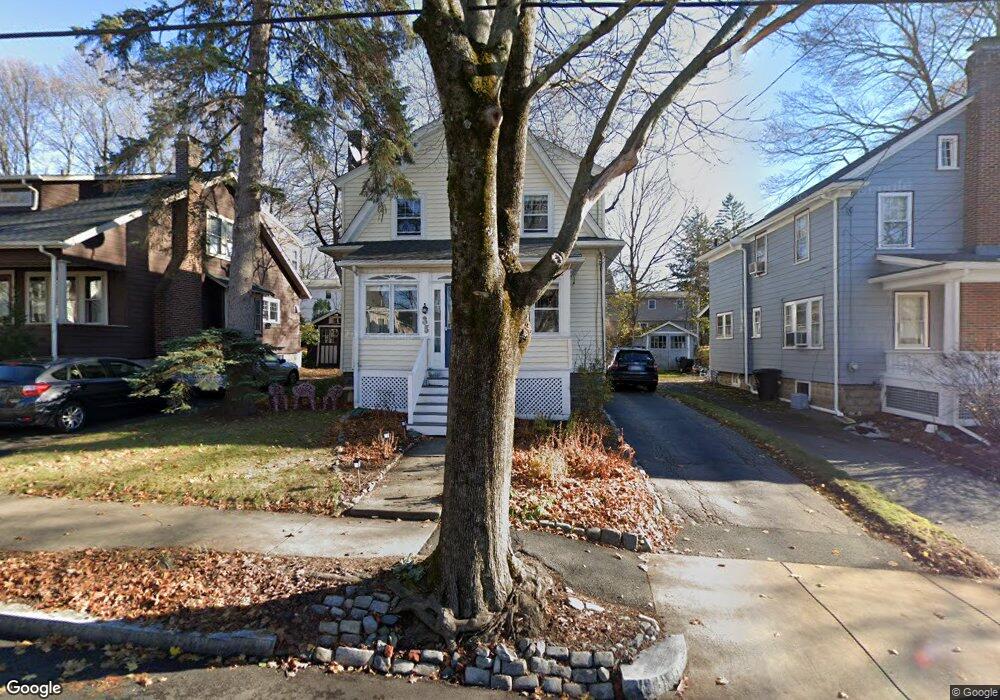
35 Ronald Rd Arlington, MA 02474
Arlington Heights NeighborhoodEstimated Value: $1,345,000 - $1,393,000
6
Beds
3
Baths
3,067
Sq Ft
$448/Sq Ft
Est. Value
About This Home
This home is located at 35 Ronald Rd, Arlington, MA 02474 and is currently estimated at $1,372,555, approximately $447 per square foot. 35 Ronald Rd is a home located in Middlesex County with nearby schools including M. Norcross Stratton Elementary School, Ottoson Middle School, and Arlington High School.
Ownership History
Date
Name
Owned For
Owner Type
Purchase Details
Closed on
Aug 9, 2011
Sold by
Salerno Melina C and Sanders Kathy M
Bought by
Sanderno T T and Sanderno S
Current Estimated Value
Purchase Details
Closed on
Oct 7, 2010
Sold by
Salerno T T and Salerno Sanders
Bought by
Salerno Melina C and Sanders Kathy M
Home Financials for this Owner
Home Financials are based on the most recent Mortgage that was taken out on this home.
Original Mortgage
$365,000
Interest Rate
4.41%
Purchase Details
Closed on
Aug 17, 2009
Sold by
Salerno Melina C and Sanders Kathy M
Bought by
Salerno Tr Melina C and Sanders Kathy M
Purchase Details
Closed on
Nov 26, 1996
Sold by
Tidmore Kurt and Oconnor Rosemary
Bought by
Salerno Melina C and Sanders Kathy M
Purchase Details
Closed on
Apr 15, 1993
Sold by
Petrowicz Dorothy E
Bought by
Tidmore Kurt and Oconnor Rosemary
Create a Home Valuation Report for This Property
The Home Valuation Report is an in-depth analysis detailing your home's value as well as a comparison with similar homes in the area
Home Values in the Area
Average Home Value in this Area
Purchase History
| Date | Buyer | Sale Price | Title Company |
|---|---|---|---|
| Sanderno T T | -- | -- | |
| Sanderno T T | -- | -- | |
| Salerno Melina C | -- | -- | |
| Salerno Melina C | -- | -- | |
| Salerno Tr Melina C | -- | -- | |
| Salerno Tr Melina C | -- | -- | |
| Salerno Melina C | $275,400 | -- | |
| Salerno Melina C | $275,400 | -- | |
| Tidmore Kurt | $208,700 | -- | |
| Tidmore Kurt | $208,700 | -- |
Source: Public Records
Mortgage History
| Date | Status | Borrower | Loan Amount |
|---|---|---|---|
| Previous Owner | Tidmore Kurt | $365,000 | |
| Previous Owner | Tidmore Kurt | $348,000 |
Source: Public Records
Tax History Compared to Growth
Tax History
| Year | Tax Paid | Tax Assessment Tax Assessment Total Assessment is a certain percentage of the fair market value that is determined by local assessors to be the total taxable value of land and additions on the property. | Land | Improvement |
|---|---|---|---|---|
| 2025 | $13,779 | $1,279,400 | $600,200 | $679,200 |
| 2024 | $12,925 | $1,220,500 | $592,900 | $627,600 |
| 2023 | $7,562 | $1,207,300 | $534,400 | $672,900 |
| 2022 | $7,236 | $1,179,300 | $512,400 | $666,900 |
| 2021 | $7,110 | $1,149,200 | $512,400 | $636,800 |
| 2020 | $12,711 | $1,149,300 | $512,400 | $636,900 |
| 2019 | $6,819 | $990,500 | $519,700 | $470,800 |
| 2018 | $6,073 | $858,800 | $388,000 | $470,800 |
| 2017 | $5,923 | $793,300 | $351,400 | $441,900 |
| 2016 | $9,966 | $778,600 | $336,700 | $441,900 |
| 2015 | $9,213 | $679,900 | $285,500 | $394,400 |
Source: Public Records
Map
Nearby Homes
- 4 Beck Rd
- 6 Appleton Place
- 14 Burton St Unit 16
- 37 Pine St
- 11 Lowell St Unit B
- 18-20 Brattle St
- 15 Higgins St Unit 17
- 1 Watermill Place Unit 304
- 1 Watermill Place Unit 308
- 51 Lowell St
- 1025 Massachusetts Ave Unit 204
- 204 Plan at Majestic Mill Brook
- 1025 Massachusetts Ave Unit 404
- 1025 Massachusetts Ave Unit 506
- 1025 Massachusetts Ave Unit 401
- 1025 Massachusetts Ave Unit 210
- 1025 Massachusetts Ave Unit 402
- 1025 Massachusetts Ave Unit 308
- 1025 Massachusetts Ave Unit 411
- 1025 Massachusetts Ave Unit 313
- 35 Ronald Rd
- 3 Ronald Rd Unit 3
- 35 Ronald Rd
- 3 Ronald Rd
- 9 Ronald Rd
- 11 Ronald Rd
- 15 Ronald Rd
- 8 Ronald Rd
- 419 Summer St Unit 421
- 421 Summer St
- 419 Summer St
- 419 Summer St Unit 1
- 421 Summer St Unit 1
- 19 Ronald Rd
- 413 Summer St
- 417 Summer St
- 417 Summer St Unit 417
- 2 Ronald Rd
- 18 Ronald Rd
- 425 Summer St