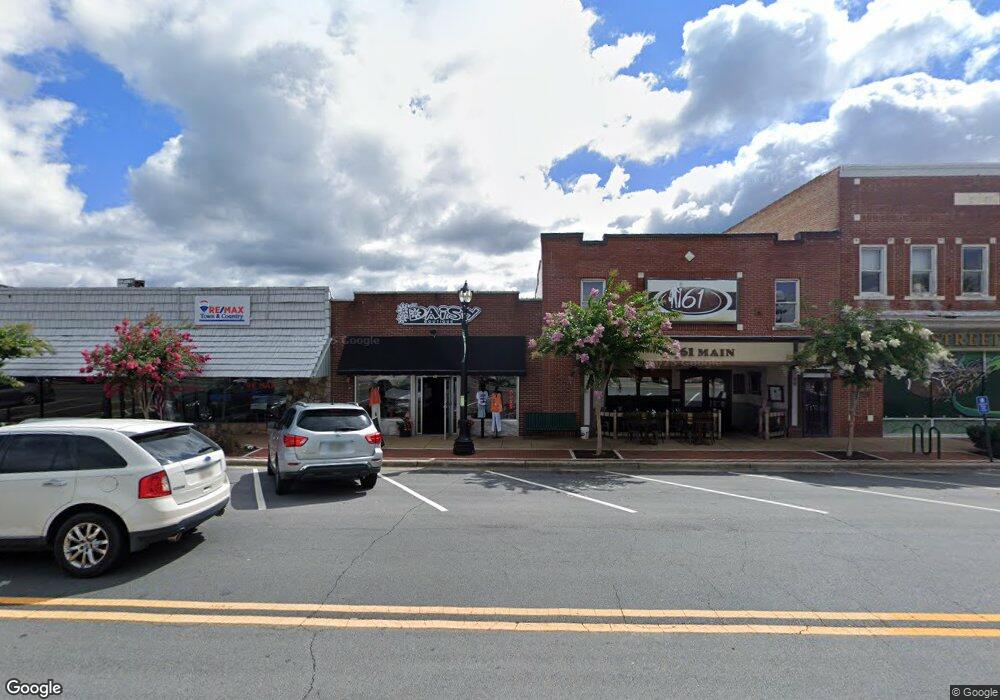
35 S Main St Unit 500 Jasper, GA 30143
Estimated Value: $366,891
--
Bed
--
Bath
2,500
Sq Ft
$147/Sq Ft
Est. Value
About This Home
This home is located at 35 S Main St Unit 500, Jasper, GA 30143 and is currently estimated at $366,891, approximately $146 per square foot. 35 S Main St Unit 500 is a home located in Pickens County with nearby schools including Harmony Elementary School, Pickens County Middle School, and Pickens County High School.
Ownership History
Date
Name
Owned For
Owner Type
Purchase Details
Closed on
Oct 11, 2024
Sold by
Colemanpaloma Llc
Bought by
North Main Real Estate Llc
Current Estimated Value
Purchase Details
Closed on
Aug 16, 2022
Sold by
Reners Llc
Bought by
Colemanpaloma Llc
Purchase Details
Closed on
Sep 8, 2021
Sold by
Fox James Roy
Bought by
Reners Llc
Home Financials for this Owner
Home Financials are based on the most recent Mortgage that was taken out on this home.
Original Mortgage
$187,500
Interest Rate
2.8%
Mortgage Type
Commercial
Purchase Details
Closed on
Jul 14, 2010
Sold by
Fox James Roy
Bought by
Fox James Roy
Purchase Details
Closed on
Nov 7, 1990
Sold by
Weeks Jimmy M and Weeks Marilu G
Bought by
Fox Mary Sue and Erwin Harriett
Purchase Details
Closed on
May 1, 1985
Bought by
Weeks Jimmy M and Weeks Marilu
Create a Home Valuation Report for This Property
The Home Valuation Report is an in-depth analysis detailing your home's value as well as a comparison with similar homes in the area
Home Values in the Area
Average Home Value in this Area
Purchase History
| Date | Buyer | Sale Price | Title Company |
|---|---|---|---|
| North Main Real Estate Llc | $360,000 | -- | |
| Colemanpaloma Llc | -- | -- | |
| Reners Llc | $250,000 | -- | |
| Fox James Roy | -- | -- | |
| Fox Mary Sue | $70,000 | -- | |
| Weeks Jimmy M | $50,000 | -- |
Source: Public Records
Mortgage History
| Date | Status | Borrower | Loan Amount |
|---|---|---|---|
| Previous Owner | Reners Llc | $187,500 |
Source: Public Records
Tax History Compared to Growth
Tax History
| Year | Tax Paid | Tax Assessment Tax Assessment Total Assessment is a certain percentage of the fair market value that is determined by local assessors to be the total taxable value of land and additions on the property. | Land | Improvement |
|---|---|---|---|---|
| 2024 | $2,670 | $104,936 | $39,396 | $65,540 |
| 2023 | $2,728 | $104,936 | $39,396 | $65,540 |
| 2022 | $2,034 | $104,936 | $39,396 | $65,540 |
| 2021 | $2,286 | $104,936 | $39,396 | $65,540 |
| 2020 | $2,355 | $104,936 | $39,396 | $65,540 |
| 2019 | $1,845 | $66,796 | $22,512 | $44,284 |
| 2018 | $1,548 | $66,796 | $22,512 | $44,284 |
| 2017 | $1,573 | $66,796 | $22,512 | $44,284 |
Source: Public Records
Map
Nearby Homes
- 288 Blazingstar Trail
- 133 Piccadilly Ln
- 261 Deerberry Dr
- 287 Lookout Valley Trail
- 72 W Sellers St
- 60 Mcwhorter St
- 8266 Cox Mountain Dr
- 172 Jacobs Way Unit A,B,C,D
- 172 Jacobs Way
- 233 Georgianna St
- 87 Jones St
- 147 Elizabeth St
- 597 S Main St
- 0 S Maple Dr Unit 7689036
- 2668 Highland Trail
- 5574 Red Fox Ln
- Lot 36 Hampton Farms Trail
- 321 Owls Brow
- 0 Hunters Ridge Rd Unit LOT 168 10559608
- 0 S Maple Dr Unit 10653282
- 35 S Main St
- 29 S Main St
- 15 S Main St Unit 3
- 15 S Main St Unit A
- 15 S Main St
- 1 S Main St
- 57 S East St
- 40 E Church St
- 106AC Seven Springs
- 69 S Main St
- 40 E Church St
- 36 E Spring St
- 66 S Main St
- 0 W Church St Unit 3.8AC 7408828
- 0 W Church St
- 0 W Church St Unit 9064786
- 0 W Church St Unit 6864654
- 0 W Church St Unit 6741864
- 0 W Church St Unit 6657539
- E E Spring St