Estimated Value: $155,096 - $211,000
Studio
2
Baths
1,301
Sq Ft
$144/Sq Ft
Est. Value
About This Home
This home is located at 35 Shaded Oaks Dr, Cabot, AR 72023 and is currently estimated at $187,274, approximately $143 per square foot. 35 Shaded Oaks Dr is a home located in Lonoke County with nearby schools including Central Elementary School, Cabot Junior High South, and Cabot Middle School South.
Ownership History
Date
Name
Owned For
Owner Type
Purchase Details
Closed on
Oct 26, 2006
Sold by
Young Dana
Bought by
Organ James P
Current Estimated Value
Home Financials for this Owner
Home Financials are based on the most recent Mortgage that was taken out on this home.
Original Mortgage
$105,060
Outstanding Balance
$62,379
Interest Rate
6.37%
Estimated Equity
$124,895
Purchase Details
Closed on
Oct 23, 2006
Sold by
Young Dana
Bought by
Organ James P
Home Financials for this Owner
Home Financials are based on the most recent Mortgage that was taken out on this home.
Original Mortgage
$105,060
Outstanding Balance
$62,379
Interest Rate
6.37%
Estimated Equity
$124,895
Purchase Details
Closed on
Oct 18, 2002
Bought by
Mosley
Purchase Details
Closed on
Feb 18, 1999
Bought by
Fleenor Added Wife Stella Mari
Purchase Details
Closed on
Nov 17, 1998
Bought by
Fleenor
Purchase Details
Closed on
Nov 12, 1997
Bought by
Ba Plat D and Ba 122
Create a Home Valuation Report for This Property
The Home Valuation Report is an in-depth analysis detailing your home's value as well as a comparison with similar homes in the area
Purchase History
| Date | Buyer | Sale Price | Title Company |
|---|---|---|---|
| Organ James P | -- | -- | |
| Organ James P | -- | -- | |
| Mosley | $90,000 | -- | |
| Mosley | $90,000 | -- | |
| Fleenor Added Wife Stella Mari | -- | -- | |
| Fleenor | $82,000 | -- | |
| Ba Plat D | -- | -- |
Source: Public Records
Mortgage History
| Date | Status | Borrower | Loan Amount |
|---|---|---|---|
| Open | Organ James P | $105,060 | |
| Closed | Organ James P | $105,060 |
Source: Public Records
Tax History
| Year | Tax Paid | Tax Assessment Tax Assessment Total Assessment is a certain percentage of the fair market value that is determined by local assessors to be the total taxable value of land and additions on the property. | Land | Improvement |
|---|---|---|---|---|
| 2025 | $602 | $20,170 | $2,600 | $17,570 |
| 2024 | $602 | $20,170 | $2,600 | $17,570 |
| 2023 | $602 | $20,170 | $2,600 | $17,570 |
| 2022 | $652 | $20,170 | $2,600 | $17,570 |
| 2021 | $651 | $20,170 | $2,600 | $17,570 |
| 2020 | $602 | $19,200 | $2,600 | $16,600 |
| 2019 | $602 | $19,200 | $2,600 | $16,600 |
| 2018 | $598 | $19,200 | $2,600 | $16,600 |
| 2017 | $881 | $19,200 | $2,600 | $16,600 |
| 2016 | $598 | $19,200 | $2,600 | $16,600 |
| 2015 | $557 | $18,360 | $2,600 | $15,760 |
| 2014 | $557 | $18,360 | $2,600 | $15,760 |
Source: Public Records
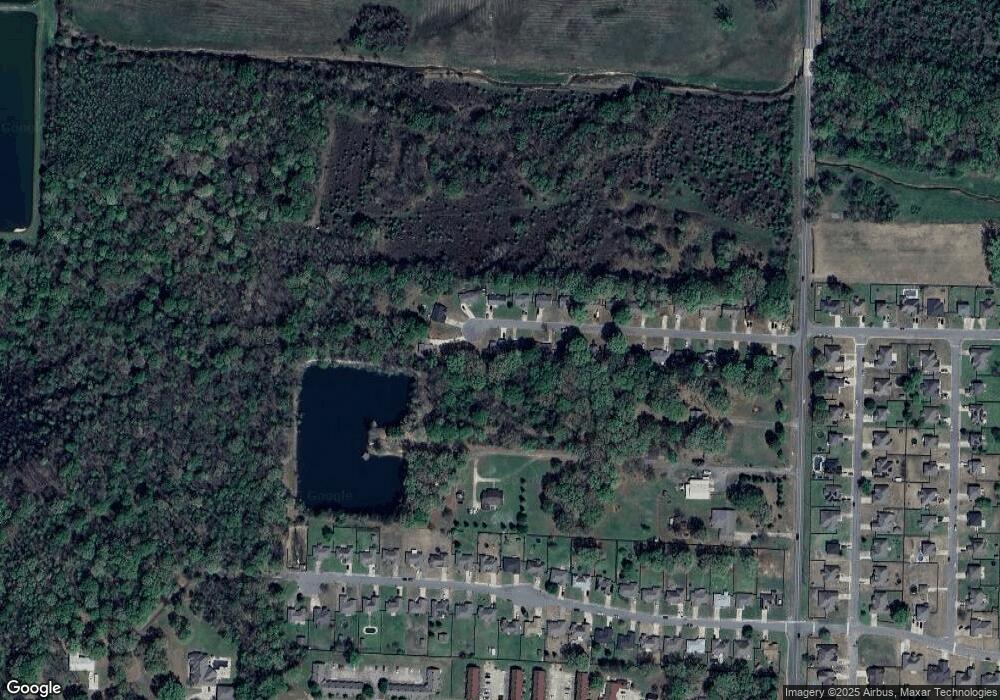
Map
Nearby Homes
- 45 Winners Cir
- 19 Talladega Dr
- 12 Daytona
- Lot 107 Southhaven
- Lots 44 &45 Broadmoor Cir
- 11 Dale Ct
- 0 Highway 321 Unit 21612963
- 15 Judith Ct
- 507 Southhaven Ave
- 23 Trinity Dr
- 51 Fieldcrest Cir
- 19 Trinity Dr
- 00 Plaza Blvd
- 11 Warren St
- 34 Bent Tree Dr
- 2302 S Pine St
- 28 Pheasant Run Dr
- 1309 S Pine St
- 1 Bill Foster Memorial Hwy E
- 10 Bill Foster Memorial Hwy E
- 33 Shaded Oaks Dr
- 31 Shaded Oaks Dr
- 34 Shaded Oaks Dr
- 32 Shaded Oaks Dr
- 36 Shaded Oaks Dr
- 29 Shaded Oaks Dr
- 38 Shaded Oaks Dr
- 30 Shaded Oaks Dr
- 37 Shaded Oaks Dr
- 28 Shaded Oaks Dr
- 27 Shaded Oaks Dr
- 26 Shaded Oaks Dr
- 25 Shaded Oaks Dr
- 24 Shaded Oaks Dr
- 23 Shaded Oaks Dr
- 22 Shaded Oaks Dr
- 2350 Kerr Station Rd
- 21 Shaded Oaks Dr
- 20 Shaded Oaks Dr
- 2320 Kerr Station Rd
Your Personal Tour Guide
Ask me questions while you tour the home.