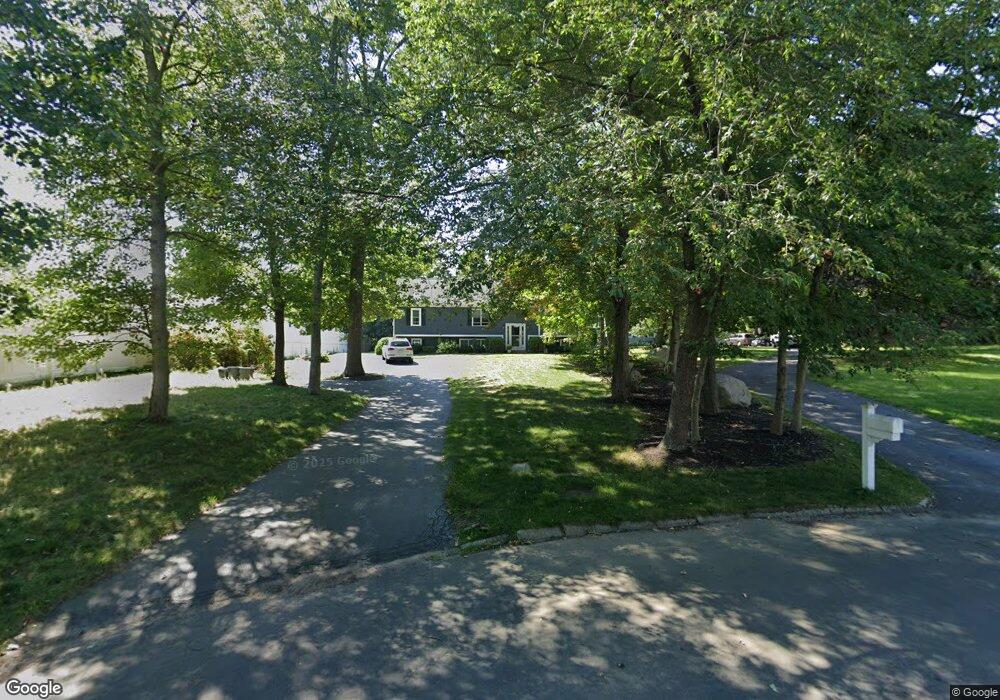
35 Sheridan Rd Braintree, MA 02184
South Braintree NeighborhoodEstimated Value: $867,978 - $1,040,000
4
Beds
3
Baths
2,209
Sq Ft
$426/Sq Ft
Est. Value
About This Home
This home is located at 35 Sheridan Rd, Braintree, MA 02184 and is currently estimated at $940,995, approximately $425 per square foot. 35 Sheridan Rd is a home located in Norfolk County with nearby schools including Braintree High School, Thayer Academy, and South Shore SDA School.
Ownership History
Date
Name
Owned For
Owner Type
Purchase Details
Closed on
Dec 15, 1995
Sold by
Jamestown Bldrs Inc
Bought by
Oconnor Maura E and Oconnor Joseph H
Current Estimated Value
Home Financials for this Owner
Home Financials are based on the most recent Mortgage that was taken out on this home.
Original Mortgage
$185,000
Outstanding Balance
$3,807
Interest Rate
7.43%
Mortgage Type
Purchase Money Mortgage
Estimated Equity
$937,188
Create a Home Valuation Report for This Property
The Home Valuation Report is an in-depth analysis detailing your home's value as well as a comparison with similar homes in the area
Home Values in the Area
Average Home Value in this Area
Purchase History
| Date | Buyer | Sale Price | Title Company |
|---|---|---|---|
| Oconnor Maura E | $235,000 | -- | |
| Oconnor Maura E | $235,000 | -- |
Source: Public Records
Mortgage History
| Date | Status | Borrower | Loan Amount |
|---|---|---|---|
| Open | Oconnor Maura E | $185,000 | |
| Closed | Oconnor Maura E | $185,000 |
Source: Public Records
Tax History Compared to Growth
Tax History
| Year | Tax Paid | Tax Assessment Tax Assessment Total Assessment is a certain percentage of the fair market value that is determined by local assessors to be the total taxable value of land and additions on the property. | Land | Improvement |
|---|---|---|---|---|
| 2025 | $8,234 | $825,100 | $394,200 | $430,900 |
| 2024 | $7,439 | $784,700 | $367,600 | $417,100 |
| 2023 | $7,059 | $723,300 | $330,300 | $393,000 |
| 2022 | $6,878 | $691,300 | $298,300 | $393,000 |
| 2021 | $6,473 | $650,600 | $269,600 | $381,000 |
| 2020 | $6,173 | $626,100 | $245,100 | $381,000 |
| 2019 | $5,831 | $577,900 | $234,400 | $343,500 |
| 2018 | $5,713 | $542,000 | $213,100 | $328,900 |
| 2017 | $5,523 | $514,200 | $202,400 | $311,800 |
| 2016 | $5,189 | $472,600 | $170,500 | $302,100 |
| 2015 | $5,180 | $467,900 | $168,300 | $299,600 |
| 2014 | $4,754 | $416,300 | $153,400 | $262,900 |
Source: Public Records
Map
Nearby Homes
- 26 Sherman Rd
- 57 Graziano Dr
- 7 Carter Rd
- 17 Royal Lake Dr Unit 4
- 80 Lake St
- 131 Jefferson St
- 6 Franklin St
- 145 Hancock St Unit 214
- 1307 Washington St
- 65 Tremont St
- 15 Highland Ave
- 56 Plain St
- 614 Pond St Unit 1405
- 614 Pond St Unit 2104
- 614 Pond St Unit 2305
- 614 Pond St Unit 1217
- 305 Franklin St
- 420 John Mahar Hwy Unit 202
- 1579 Washington St
- 418 John Mahar Hwy Unit 408