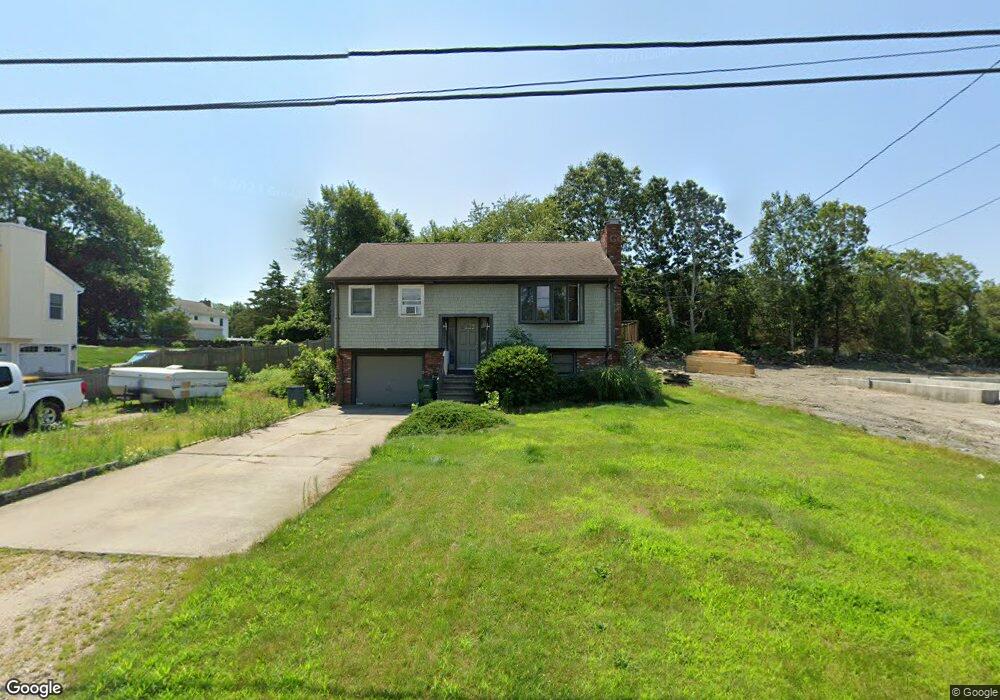
35 Sloop St Jamestown, RI 02835
West Reach Estates NeighborhoodEstimated Value: $686,000 - $954,000
2
Beds
2
Baths
1,476
Sq Ft
$518/Sq Ft
Est. Value
About This Home
This home is located at 35 Sloop St, Jamestown, RI 02835 and is currently estimated at $763,950, approximately $517 per square foot. 35 Sloop St is a home located in Newport County with nearby schools including Melrose Avenue School and Lawn Avenue School.
Ownership History
Date
Name
Owned For
Owner Type
Purchase Details
Closed on
May 12, 2016
Sold by
Piccoli David L and Piccoli Gildae
Bought by
35 Sloop Llc
Current Estimated Value
Purchase Details
Closed on
Oct 20, 1999
Sold by
Feeney Robert J Est
Bought by
Piccoli David L and Piccoli Gilda
Home Financials for this Owner
Home Financials are based on the most recent Mortgage that was taken out on this home.
Original Mortgage
$99,400
Interest Rate
7.83%
Mortgage Type
Purchase Money Mortgage
Purchase Details
Closed on
Jun 2, 1997
Sold by
Peterson Kevin E and Peterson Pamela
Bought by
Ivy Dev Co Llc
Home Financials for this Owner
Home Financials are based on the most recent Mortgage that was taken out on this home.
Original Mortgage
$112,800
Interest Rate
8.09%
Mortgage Type
Purchase Money Mortgage
Create a Home Valuation Report for This Property
The Home Valuation Report is an in-depth analysis detailing your home's value as well as a comparison with similar homes in the area
Home Values in the Area
Average Home Value in this Area
Purchase History
| Date | Buyer | Sale Price | Title Company |
|---|---|---|---|
| 35 Sloop Llc | -- | -- | |
| Piccoli David L | $142,000 | -- | |
| Ivy Dev Co Llc | $95,000 | -- |
Source: Public Records
Mortgage History
| Date | Status | Borrower | Loan Amount |
|---|---|---|---|
| Previous Owner | Ivy Dev Co Llc | $99,400 | |
| Previous Owner | Ivy Dev Co Llc | $112,800 | |
| Previous Owner | Ivy Dev Co Llc | $46,000 |
Source: Public Records
Tax History
| Year | Tax Paid | Tax Assessment Tax Assessment Total Assessment is a certain percentage of the fair market value that is determined by local assessors to be the total taxable value of land and additions on the property. | Land | Improvement |
|---|---|---|---|---|
| 2025 | $1,998 | $354,200 | $230,500 | $123,700 |
| 2024 | $3,140 | $437,900 | $174,600 | $263,300 |
| 2023 | $3,057 | $437,900 | $174,600 | $263,300 |
| 2022 | $2,973 | $437,900 | $174,600 | $263,300 |
| 2021 | $2,301 | $277,900 | $140,600 | $137,300 |
| 2020 | $2,243 | $277,900 | $140,600 | $137,300 |
| 2019 | $2,237 | $277,900 | $140,600 | $137,300 |
| 2018 | $2,373 | $268,100 | $125,600 | $142,500 |
| 2017 | $2,322 | $268,100 | $125,600 | $142,500 |
| 2016 | $2,300 | $268,100 | $125,600 | $142,500 |
| 2015 | $2,170 | $247,200 | $146,800 | $100,400 |
| 2014 | -- | $241,500 | $141,100 | $100,400 |
Source: Public Records
Map
Nearby Homes
- 400 Schooner Ave
- 86 Spanker St
- 777 E Shore Rd
- 174 Seaside Dr
- 121 Seaside Dr
- 44 Mast St
- 0 Circuit Ave
- 31 Buloid Ave
- 127 Longfellow Rd
- 63 Longfellow Rd
- 46 North Rd
- 83 Oceanwoods Dr
- 30 W Bay View Dr
- 73 Conanicus Ave Unit 4
- 78 Narragansett Ave
- 77 Narragansett Ave Unit C
- 14 Clinton Ave
- 22 Cole St
- 0 Walcott Ave
- 480 Boston Neck Rd
Your Personal Tour Guide
Ask me questions while you tour the home.