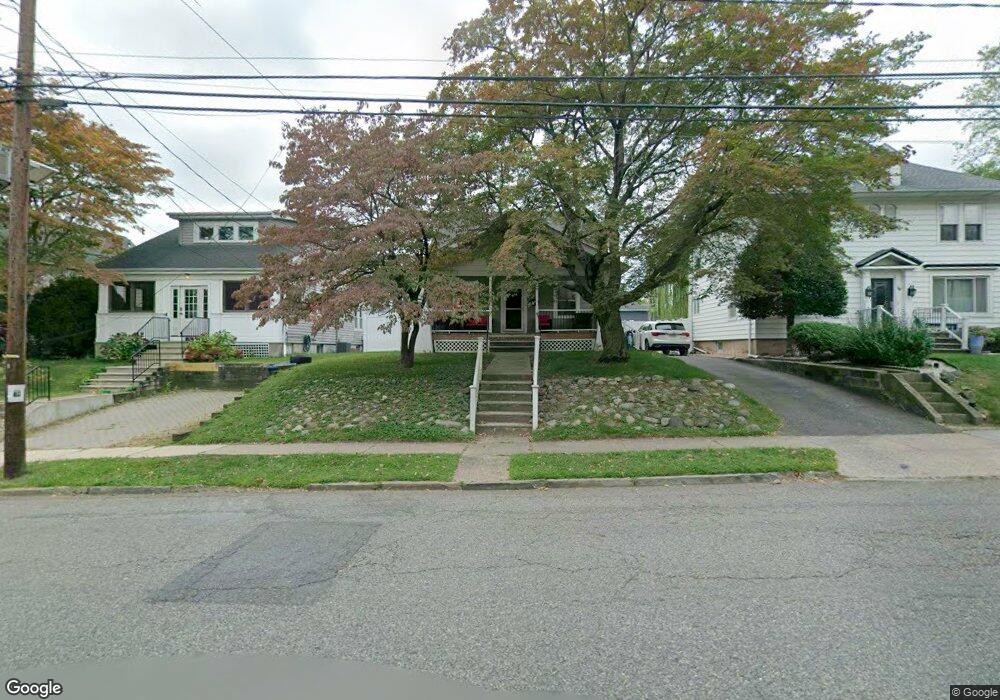
35 Spring Valley Ave Hackensack, NJ 07601
Estimated Value: $586,963 - $690,000
Studio
--
Bath
1,633
Sq Ft
$393/Sq Ft
Est. Value
About This Home
This home is located at 35 Spring Valley Ave, Hackensack, NJ 07601 and is currently estimated at $641,741, approximately $392 per square foot. 35 Spring Valley Ave is a home located in Bergen County with nearby schools including Hackensack High School, Bergen County Christian Academy, and Ben Porat Yosef.
Ownership History
Date
Name
Owned For
Owner Type
Purchase Details
Closed on
Dec 25, 2014
Sold by
Mullane Robert Arthur
Bought by
Beltre Sandy and Ynoa Gladys Batista
Current Estimated Value
Home Financials for this Owner
Home Financials are based on the most recent Mortgage that was taken out on this home.
Original Mortgage
$223,250
Outstanding Balance
$171,503
Interest Rate
3.92%
Mortgage Type
New Conventional
Estimated Equity
$470,238
Create a Home Valuation Report for This Property
The Home Valuation Report is an in-depth analysis detailing your home's value as well as a comparison with similar homes in the area
Home Values in the Area
Average Home Value in this Area
Purchase History
| Date | Buyer | Sale Price | Title Company |
|---|---|---|---|
| Beltre Sandy | $230,000 | Attorney |
Source: Public Records
Mortgage History
| Date | Status | Borrower | Loan Amount |
|---|---|---|---|
| Open | Beltre Sandy | $223,250 |
Source: Public Records
Tax History
| Year | Tax Paid | Tax Assessment Tax Assessment Total Assessment is a certain percentage of the fair market value that is determined by local assessors to be the total taxable value of land and additions on the property. | Land | Improvement |
|---|---|---|---|---|
| 2025 | $11,432 | $374,100 | $218,800 | $155,300 |
| 2024 | $10,770 | $374,100 | $218,800 | $155,300 |
| 2023 | $9,958 | $374,100 | $218,800 | $155,300 |
| 2022 | $10,208 | $364,300 | $210,000 | $154,300 |
| 2021 | $9,774 | $298,500 | $176,000 | $122,500 |
| 2020 | $9,877 | $298,500 | $176,000 | $122,500 |
| 2019 | $9,873 | $294,100 | $173,500 | $120,600 |
| 2018 | $9,884 | $289,600 | $170,000 | $119,600 |
| 2017 | $9,740 | $285,200 | $167,500 | $117,700 |
| 2016 | $9,063 | $268,300 | $152,500 | $115,800 |
| 2015 | $8,822 | $259,200 | $155,100 | $104,100 |
| 2014 | $8,361 | $259,200 | $155,100 | $104,100 |
Source: Public Records
Map
Nearby Homes
- 75 Pine St
- 67 Spring Valley Ave
- 29 Martin Terrace
- 32 Martin Terrace
- 81 Fairmount Ave
- 150 Grand Ave Unit 1A
- 95 Cedar Ave
- 120 Louis St
- 258 Ross Ave
- 15 Zabriskie St Unit 1505
- 207 Elm Ave
- 30 Willow Ave
- 258 Clinton Place
- 140 Euclid Ave Unit 6E
- 140 Euclid Ave Unit 1G
- 290 Clinton Place
- 25 Jefferson St Unit 4E
- 25 Jefferson St Unit 3D
- 16 Jefferson St
- 300 Lookout Ave Unit C4
- 31 Spring Valley Ave
- 39 Spring Valley Ave
- 103 Pine St
- 111 Pine St
- 676 Prospect Ave N
- 101 Pine St
- 49 Spring Valley Ave
- 84 Elm Ave
- 84 Elm Ave Unit 1
- 84 Elm Ave Unit 2
- 670 Prospect Ave N
- 51 Spring Valley Ave
- 80 Elm Ave
- 677 Prospect Ave N
- 32 Spring Valley Ave
- 36 Spring Valley Ave
- 42 Spring Valley Ave
- 95 Pine St
- 19 Spring Valley Ave
- 98 Elm Ave
Your Personal Tour Guide
Ask me questions while you tour the home.