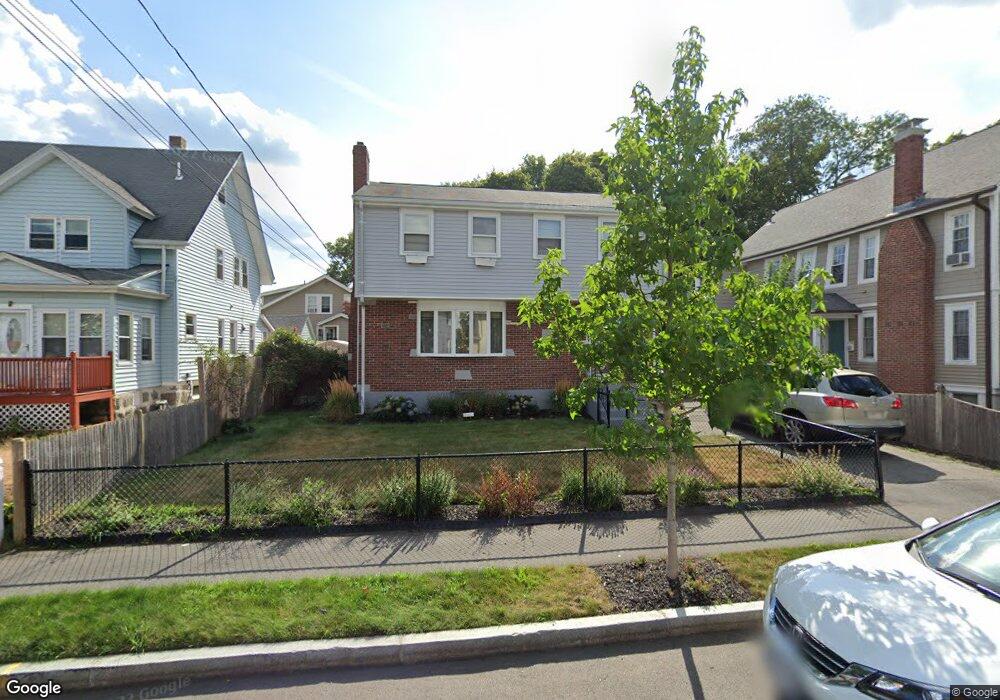
35 Taylor St Quincy, MA 02170
Montclair NeighborhoodEstimated Value: $703,000 - $836,000
4
Beds
2
Baths
1,596
Sq Ft
$485/Sq Ft
Est. Value
About This Home
This home is located at 35 Taylor St, Quincy, MA 02170 and is currently estimated at $774,044, approximately $484 per square foot. 35 Taylor St is a home located in Norfolk County with nearby schools including Montclair Elementary School, Atlantic Middle School, and North Quincy High School.
Ownership History
Date
Name
Owned For
Owner Type
Purchase Details
Closed on
Sep 28, 2001
Sold by
Keane John
Bought by
Dalton Kathieanne
Current Estimated Value
Home Financials for this Owner
Home Financials are based on the most recent Mortgage that was taken out on this home.
Original Mortgage
$160,000
Outstanding Balance
$62,721
Interest Rate
6.91%
Mortgage Type
Purchase Money Mortgage
Estimated Equity
$711,323
Create a Home Valuation Report for This Property
The Home Valuation Report is an in-depth analysis detailing your home's value as well as a comparison with similar homes in the area
Home Values in the Area
Average Home Value in this Area
Purchase History
| Date | Buyer | Sale Price | Title Company |
|---|---|---|---|
| Dalton Kathieanne | $200,000 | -- |
Source: Public Records
Mortgage History
| Date | Status | Borrower | Loan Amount |
|---|---|---|---|
| Open | Dalton Kathieanne | $160,000 |
Source: Public Records
Tax History
| Year | Tax Paid | Tax Assessment Tax Assessment Total Assessment is a certain percentage of the fair market value that is determined by local assessors to be the total taxable value of land and additions on the property. | Land | Improvement |
|---|---|---|---|---|
| 2025 | $7,774 | $674,200 | $334,200 | $340,000 |
| 2024 | $7,520 | $667,300 | $334,200 | $333,100 |
| 2023 | $6,992 | $628,200 | $318,300 | $309,900 |
| 2022 | $6,765 | $564,700 | $276,800 | $287,900 |
| 2021 | $6,568 | $541,000 | $263,700 | $277,300 |
| 2020 | $6,449 | $518,800 | $263,700 | $255,100 |
| 2019 | $6,123 | $487,900 | $246,400 | $241,500 |
| 2018 | $6,184 | $463,600 | $228,100 | $235,500 |
| 2017 | $6,103 | $430,700 | $217,300 | $213,400 |
| 2016 | $5,579 | $388,500 | $188,900 | $199,600 |
| 2015 | $5,179 | $354,700 | $171,700 | $183,000 |
| 2014 | $4,931 | $331,800 | $163,600 | $168,200 |
Source: Public Records
Map
Nearby Homes
- 73 Taylor St
- 98 Safford St
- 267-269 Farrington St
- 134 Sherman St
- 45 Holbrook Rd
- 198 Taylor St
- 157 Beale St Unit 6
- 115 W Squantum St Unit 607
- 115 W Squantum St Unit 203
- 17 Holmes St Unit 101
- 17 Holmes St Unit 1
- 169 Pine St
- 30 Elmwood Park
- 165 Milton St
- 116 Rawson Rd
- 33 Bishop Rd Unit 33
- 113 Elm Ave
- 475 Beale St
- 0 Franklin St
- 18 Clark St
- 29 Taylor St
- 105 Hobart St
- 27 Taylor St
- 94 Highland Ave
- 36 Taylor St
- 96 Highland Ave
- 30 Taylor St
- 40 Taylor St Unit 2
- 40 Taylor St
- 40 Taylor St Unit 1
- 21 Taylor St
- 47 Taylor St
- 98 Highland Ave
- 98 Highland Ave Unit 1
- 92 Highland Ave
- 26 Taylor St
- 104 Hobart St
- 88 Highland Ave
- 17 Taylor St
- 51 Taylor St
Your Personal Tour Guide
Ask me questions while you tour the home.