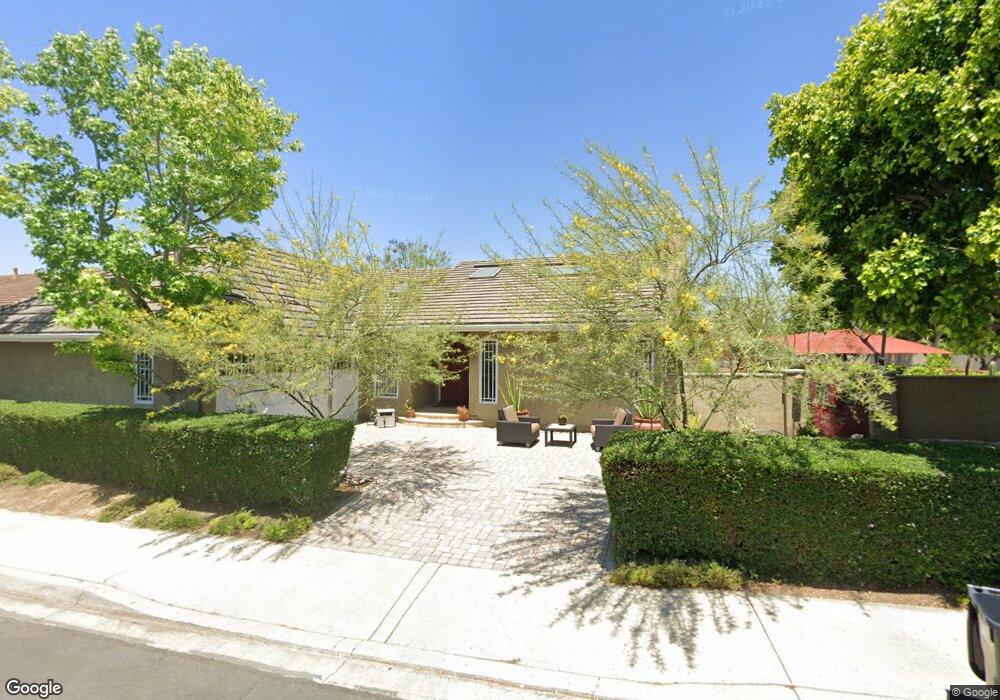
35 Timberline Irvine, CA 92604
Walnut NeighborhoodEstimated Value: $1,527,000 - $1,681,000
3
Beds
2
Baths
1,906
Sq Ft
$849/Sq Ft
Est. Value
About This Home
This home is located at 35 Timberline, Irvine, CA 92604 and is currently estimated at $1,618,533, approximately $849 per square foot. 35 Timberline is a home located in Orange County with nearby schools including Deerfield Elementary School, Venado Middle School, and Irvine High School.
Ownership History
Date
Name
Owned For
Owner Type
Purchase Details
Closed on
Oct 12, 2021
Sold by
Girard Francine and Baeza Hector E
Bought by
Baeza Hector E and Girard Francine
Current Estimated Value
Home Financials for this Owner
Home Financials are based on the most recent Mortgage that was taken out on this home.
Original Mortgage
$400,000
Outstanding Balance
$364,763
Interest Rate
2.8%
Mortgage Type
New Conventional
Estimated Equity
$1,253,770
Purchase Details
Closed on
Jan 26, 2006
Sold by
Baeza Hector E and Girard Francine
Bought by
Baeza Hector E and Girard Francine
Purchase Details
Closed on
Oct 31, 1994
Sold by
Weiner Alan S and Weiner Amy Simon
Bought by
Baeza Hector E and Girard Francine
Home Financials for this Owner
Home Financials are based on the most recent Mortgage that was taken out on this home.
Original Mortgage
$203,150
Interest Rate
8.91%
Create a Home Valuation Report for This Property
The Home Valuation Report is an in-depth analysis detailing your home's value as well as a comparison with similar homes in the area
Home Values in the Area
Average Home Value in this Area
Purchase History
| Date | Buyer | Sale Price | Title Company |
|---|---|---|---|
| Baeza Hector E | -- | Accommodation | |
| Girard Francine | -- | Wfg National Title | |
| Baeza Hector E | -- | None Available | |
| Baeza Hector E | $261,000 | First American Title |
Source: Public Records
Mortgage History
| Date | Status | Borrower | Loan Amount |
|---|---|---|---|
| Open | Girard Francine | $400,000 | |
| Closed | Baeza Hector E | $203,150 |
Source: Public Records
Tax History
| Year | Tax Paid | Tax Assessment Tax Assessment Total Assessment is a certain percentage of the fair market value that is determined by local assessors to be the total taxable value of land and additions on the property. | Land | Improvement |
|---|---|---|---|---|
| 2025 | $4,645 | $438,390 | $251,226 | $187,164 |
| 2024 | $4,645 | $429,795 | $246,300 | $183,495 |
| 2023 | $4,524 | $421,368 | $241,470 | $179,898 |
| 2022 | $4,422 | $413,106 | $236,735 | $176,371 |
| 2021 | $4,318 | $405,006 | $232,093 | $172,913 |
| 2020 | $4,293 | $400,854 | $229,714 | $171,140 |
| 2019 | $4,197 | $392,995 | $225,210 | $167,785 |
| 2018 | $4,120 | $385,290 | $220,794 | $164,496 |
| 2017 | $4,034 | $377,736 | $216,465 | $161,271 |
| 2016 | $3,858 | $370,330 | $212,221 | $158,109 |
| 2015 | $3,800 | $364,768 | $209,033 | $155,735 |
| 2014 | $3,726 | $357,623 | $204,938 | $152,685 |
Source: Public Records
Map
Nearby Homes
- 14 Dragonfly Unit 25
- 57 Pinewood Unit 29
- 18 Brookdale
- 4862 Gainsport Cir
- 14921 Pinehaven Rd
- 12 Oakdale
- 5101 Chateau Cir
- 95 Wildwood Unit 40
- 5011 Yearling Ave
- 15232 Lille Cir
- 26 Morning Dove
- 4511 Charleville Cir
- 15441 Alsace Cir
- 52 Shadowbrook
- 4161 Old Mill St
- 14851 Jeffrey Rd Unit 248
- 14851 Jeffrey Rd Unit 69
- 14851 Jeffrey Rd Unit 61
- 14851 Jeffrey Rd Unit 192
- 14851 Jeffrey Rd Unit 241
Your Personal Tour Guide
Ask me questions while you tour the home.