
Seller's Agent in 2025
David Splaine
RE/MAX Professionals
(401) 465-6996
1 in this area
103 Total Sales
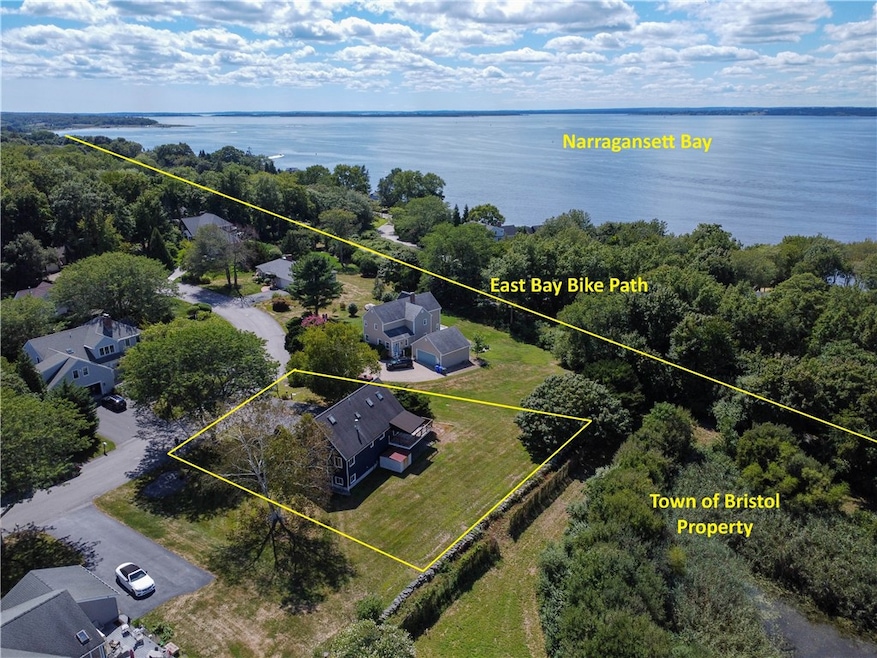
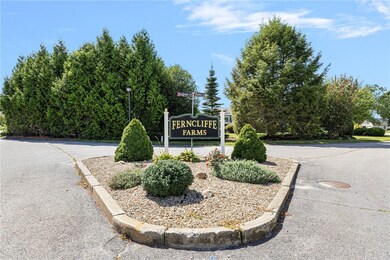
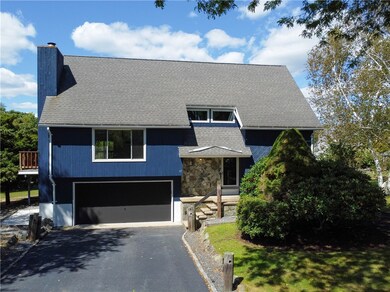
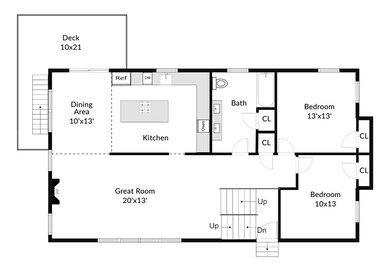
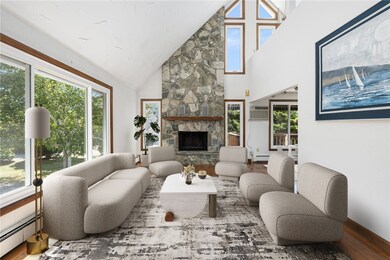
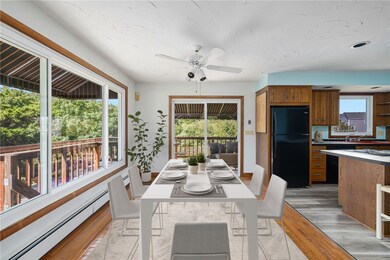
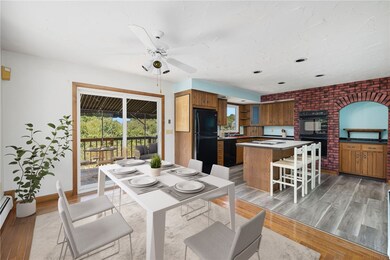
35 Tobin Lane in Ferncliffe Farms is ready for you to make it your own! This contemporary has a terrific layout with a 13 x 20 Great Room featuring a vaulted ceiling with a stone fireplace, hardwood floors, and loads of light. The kitchen is original with oak cabinets and a center island. The dining area leads out to a 10 x 21 deck that is covered by an awning and looks out on a beautiful natural lot owned by the Town of Bristol. The roof is in good condition, as are the hardwoods, and all the windows were replaced just last year. The primary suite is on the second floor along with a 9 x 20 flex space that overlooks the Great Room below and could be an office or another family room. On the lower level is a two-car garage, lavette, laundry room, storage area, and an 11 x 23 Rec Room. Access to the East Bay Bike Path and a right-of-way to the waterfront are just a couple of streets over at the end of Beach Road. Clements' Market is only 1.2 miles away, and the Bristol waterfront, shops, and restaurants are just 2.8 miles away. Offers are due by noon on Wednesday 9/10.
Last Agent to Sell the Property
RE/MAX Professionals License #RES.0028076 Listed on: 09/04/2025
| Date | Type | Sale Price | Title Company |
|---|---|---|---|
| Deed | $725,000 | -- | |
| Deed | -- | -- | |
| Deed | -- | -- |
| Date | Status | Loan Amount | Loan Type |
|---|---|---|---|
| Previous Owner | $250,000 | Stand Alone Refi Refinance Of Original Loan |
| Date | Event | Price | List to Sale | Price per Sq Ft |
|---|---|---|---|---|
| 09/27/2025 09/27/25 | Sold | $725,000 | +16.0% | $371 / Sq Ft |
| 09/10/2025 09/10/25 | Pending | -- | -- | -- |
| 09/04/2025 09/04/25 | For Sale | $625,000 | -- | $320 / Sq Ft |
| Year | Tax Paid | Tax Assessment Tax Assessment Total Assessment is a certain percentage of the fair market value that is determined by local assessors to be the total taxable value of land and additions on the property. | Land | Improvement |
|---|---|---|---|---|
| 2025 | $6,348 | $661,300 | $278,500 | $382,800 |
| 2024 | $7,015 | $507,600 | $232,100 | $275,500 |
| 2023 | $6,782 | $507,600 | $232,100 | $275,500 |
| 2022 | $6,599 | $507,600 | $232,100 | $275,500 |
| 2021 | $7,411 | $515,400 | $306,900 | $208,500 |
| 2020 | $7,252 | $515,400 | $306,900 | $208,500 |
| 2019 | $7,071 | $515,400 | $306,900 | $208,500 |
| 2018 | $7,009 | $455,700 | $308,200 | $147,500 |
| 2017 | $6,157 | $412,700 | $292,800 | $119,900 |
| 2016 | $6,096 | $412,700 | $292,800 | $119,900 |
| 2015 | $5,790 | $412,700 | $292,800 | $119,900 |
| 2014 | $5,970 | $457,100 | $254,200 | $202,900 |
Seller's Agent in 2025
David Splaine
RE/MAX Professionals
(401) 465-6996
1 in this area
103 Total Sales
Buyer's Agent in 2025
Joe Fitzpatrick
RE/MAX Results
(401) 835-2045
11 in this area
687 Total Sales
Source: State-Wide MLS
MLS Number: 1394259
APN: BRIS-000055-000000-000047
Disclaimer: Certain information contained herein is derived from information provided by parties other than Homes.com. All information provided is deemed reliable, but is not guaranteed to be accurate and should be independently verified.
![]() IDX information is provided exclusively for personal, non-commercial use, and may not be used for any purpose other than to identify prospective properties consumers may be interested in purchasing. Information is deemed reliable but not guaranteed.
IDX information is provided exclusively for personal, non-commercial use, and may not be used for any purpose other than to identify prospective properties consumers may be interested in purchasing. Information is deemed reliable but not guaranteed.
Copyright © 2025 State-Wide MLS, Inc. All rights reserved.