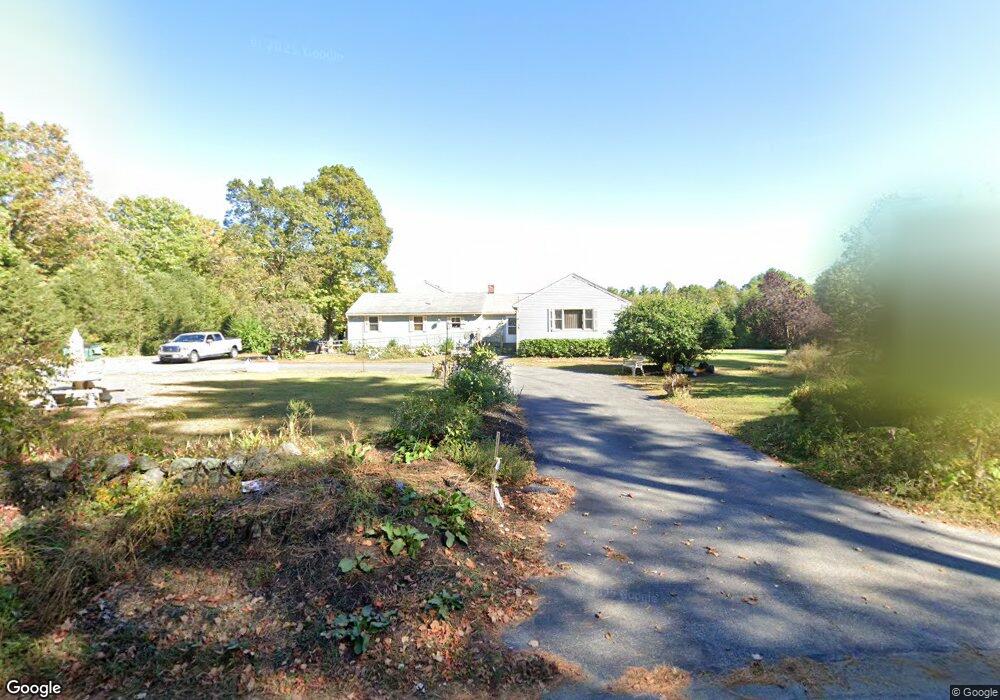
35 West St Unit A Pepperell, MA 01463
Estimated Value: $681,000 - $1,024,000
4
Beds
4
Baths
2,469
Sq Ft
$333/Sq Ft
Est. Value
About This Home
This home is located at 35 West St Unit A, Pepperell, MA 01463 and is currently estimated at $821,733, approximately $332 per square foot. 35 West St Unit A is a home located in Middlesex County with nearby schools including North Middlesex Regional High School.
Ownership History
Date
Name
Owned For
Owner Type
Purchase Details
Closed on
Nov 19, 1999
Sold by
Wojick Thomas H
Bought by
Durocher Harold J and Durocher Pamela
Current Estimated Value
Home Financials for this Owner
Home Financials are based on the most recent Mortgage that was taken out on this home.
Original Mortgage
$199,000
Outstanding Balance
$60,799
Interest Rate
7.76%
Mortgage Type
Purchase Money Mortgage
Estimated Equity
$760,934
Purchase Details
Closed on
Sep 18, 1998
Sold by
Penko John M
Bought by
Wojick Thomas H
Create a Home Valuation Report for This Property
The Home Valuation Report is an in-depth analysis detailing your home's value as well as a comparison with similar homes in the area
Home Values in the Area
Average Home Value in this Area
Purchase History
| Date | Buyer | Sale Price | Title Company |
|---|---|---|---|
| Durocher Harold J | $349,000 | -- | |
| Wojick Thomas H | $82,500 | -- |
Source: Public Records
Mortgage History
| Date | Status | Borrower | Loan Amount |
|---|---|---|---|
| Open | Wojick Thomas H | $199,000 | |
| Previous Owner | Wojick Thomas H | $170,000 |
Source: Public Records
Tax History
| Year | Tax Paid | Tax Assessment Tax Assessment Total Assessment is a certain percentage of the fair market value that is determined by local assessors to be the total taxable value of land and additions on the property. | Land | Improvement |
|---|---|---|---|---|
| 2025 | $9,511 | $650,100 | $169,500 | $480,600 |
| 2024 | $9,098 | $634,000 | $153,400 | $480,600 |
| 2023 | $8,836 | $583,600 | $130,600 | $453,000 |
| 2022 | $9,201 | $536,500 | $128,800 | $407,700 |
| 2021 | $9,154 | $510,800 | $112,700 | $398,100 |
| 2020 | $8,772 | $516,600 | $112,700 | $403,900 |
| 2019 | $8,492 | $511,900 | $112,700 | $399,200 |
| 2018 | $8,052 | $491,300 | $112,700 | $378,600 |
| 2017 | $7,824 | $492,400 | $112,700 | $379,700 |
| 2016 | $7,445 | $450,400 | $112,700 | $337,700 |
| 2015 | $7,184 | $450,400 | $112,700 | $337,700 |
| 2014 | $6,227 | $392,600 | $112,700 | $279,900 |
Source: Public Records
Map
Nearby Homes
- 122 Jewett St
- 2 Blueberry Hill Rd
- 143 Heald St
- 102 Wheeler St
- 10 Lakin St
- 22 Lakin St
- 120 Townsend St Unit 1
- 120 Townsend St Unit 2
- 109 Townsend St
- 18 Maple St Unit 14
- 21 Magnolia Ln
- 18 Beech St
- 6 Mason St Unit 31
- 144 Main St
- 64 Maplewood Dr
- Lot 10 Christian Cir
- 55 Park St
- 364 Townsend Hill Rd
- 6 High Oaks Path
- 15 N End Rd