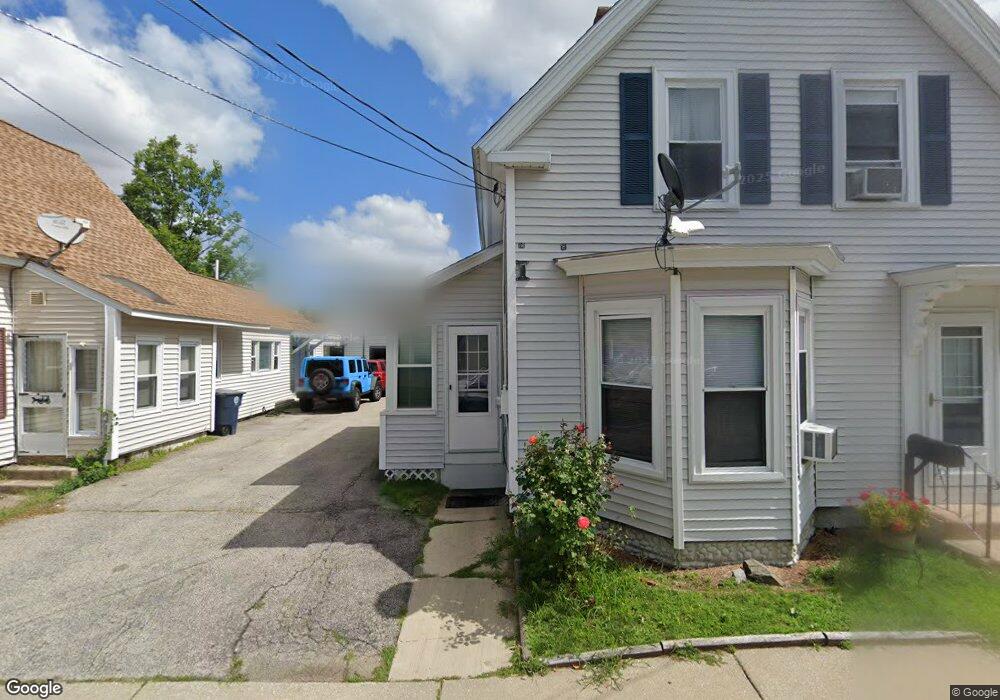
35 Williams Ct Nashua, NH 03060
Downtown Nashua NeighborhoodEstimated Value: $390,039 - $495,000
5
Beds
2
Baths
1,659
Sq Ft
$266/Sq Ft
Est. Value
About This Home
This home is located at 35 Williams Ct, Nashua, NH 03060 and is currently estimated at $440,760, approximately $265 per square foot. 35 Williams Ct is a home located in Hillsborough County with nearby schools including Amherst Street School, Pennichuck Middle School, and Nashua High School North.
Ownership History
Date
Name
Owned For
Owner Type
Purchase Details
Closed on
Jan 26, 2022
Sold by
Houle Scott M
Bought by
3-5 Williams Court Ret and Houle
Current Estimated Value
Purchase Details
Closed on
Mar 15, 2021
Sold by
3-5 Williams Court Rt and Stevens
Bought by
Houle Scott M
Home Financials for this Owner
Home Financials are based on the most recent Mortgage that was taken out on this home.
Original Mortgage
$270,460
Interest Rate
2.7%
Mortgage Type
Purchase Money Mortgage
Create a Home Valuation Report for This Property
The Home Valuation Report is an in-depth analysis detailing your home's value as well as a comparison with similar homes in the area
Home Values in the Area
Average Home Value in this Area
Purchase History
| Date | Buyer | Sale Price | Title Company |
|---|---|---|---|
| 3-5 Williams Court Ret | -- | None Available | |
| Houle Scott M | $265,000 | None Available |
Source: Public Records
Mortgage History
| Date | Status | Borrower | Loan Amount |
|---|---|---|---|
| Previous Owner | Houle Scott M | $270,460 |
Source: Public Records
Tax History Compared to Growth
Tax History
| Year | Tax Paid | Tax Assessment Tax Assessment Total Assessment is a certain percentage of the fair market value that is determined by local assessors to be the total taxable value of land and additions on the property. | Land | Improvement |
|---|---|---|---|---|
| 2024 | $5,109 | $321,300 | $101,800 | $219,500 |
| 2023 | $4,959 | $272,000 | $81,400 | $190,600 |
| 2022 | $4,915 | $272,000 | $81,400 | $190,600 |
| 2021 | $3,817 | $164,400 | $43,400 | $121,000 |
| 2020 | $3,735 | $165,200 | $43,900 | $121,300 |
| 2019 | $3,595 | $165,200 | $43,900 | $121,300 |
| 2018 | $3,504 | $165,200 | $43,900 | $121,300 |
| 2017 | $3,309 | $128,300 | $45,800 | $82,500 |
| 2016 | $3,216 | $128,300 | $45,800 | $82,500 |
| 2015 | $3,147 | $128,300 | $45,800 | $82,500 |
| 2014 | -- | $128,300 | $45,800 | $82,500 |
Source: Public Records
Map
Nearby Homes