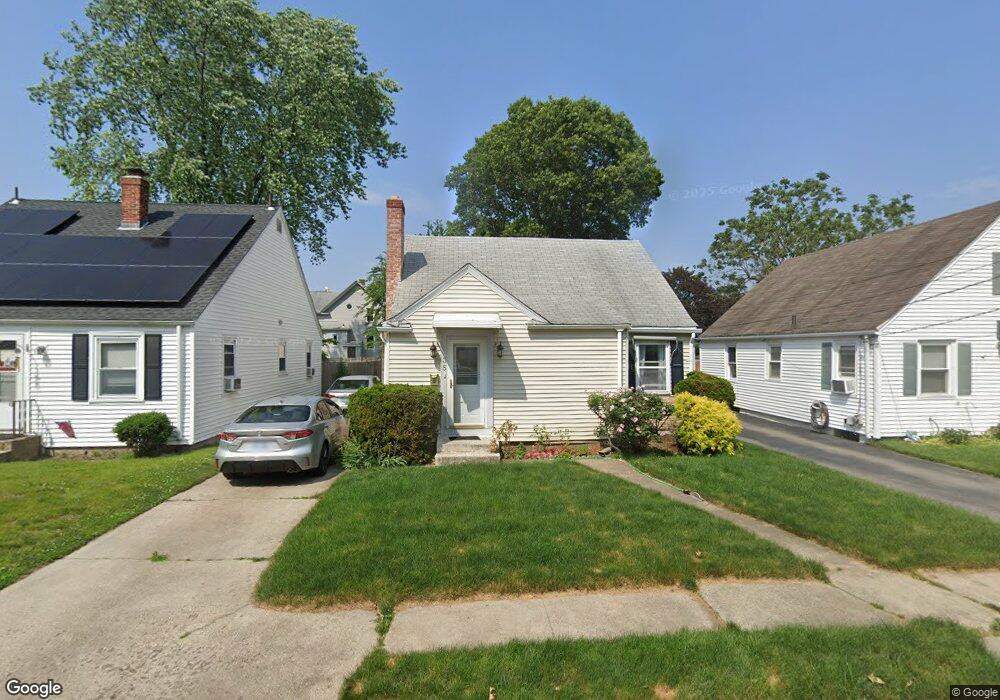
35 Wollaston St Cranston, RI 02910
Auburn NeighborhoodEstimated Value: $404,214 - $450,000
3
Beds
2
Baths
1,399
Sq Ft
$306/Sq Ft
Est. Value
About This Home
This home is located at 35 Wollaston St, Cranston, RI 02910 and is currently estimated at $428,054, approximately $305 per square foot. 35 Wollaston St is a home located in Providence County with nearby schools including Eden Park Elementary School, Park View Middle School, and Cranston High School East.
Ownership History
Date
Name
Owned For
Owner Type
Purchase Details
Closed on
May 23, 2011
Sold by
Gainey Robert W
Bought by
Federal National Mortgage Association
Current Estimated Value
Purchase Details
Closed on
Oct 26, 2001
Sold by
Ciampanelli Steven
Bought by
Mccaffrey Thomas J
Purchase Details
Closed on
Nov 2, 1998
Sold by
Giampanelli Mary A
Bought by
Ciampanelli Steven
Create a Home Valuation Report for This Property
The Home Valuation Report is an in-depth analysis detailing your home's value as well as a comparison with similar homes in the area
Home Values in the Area
Average Home Value in this Area
Purchase History
| Date | Buyer | Sale Price | Title Company |
|---|---|---|---|
| Federal National Mortgage Association | -- | -- | |
| Mccaffrey Thomas J | $134,000 | -- | |
| Ciampanelli Steven | $80,000 | -- |
Source: Public Records
Mortgage History
| Date | Status | Borrower | Loan Amount |
|---|---|---|---|
| Previous Owner | Ciampanelli Steven | $93,314 | |
| Previous Owner | Ciampanelli Steven | $28,000 | |
| Previous Owner | Ciampanelli Steven | $158,000 |
Source: Public Records
Tax History
| Year | Tax Paid | Tax Assessment Tax Assessment Total Assessment is a certain percentage of the fair market value that is determined by local assessors to be the total taxable value of land and additions on the property. | Land | Improvement |
|---|---|---|---|---|
| 2025 | $4,537 | $326,900 | $94,300 | $232,600 |
| 2024 | $4,449 | $326,900 | $94,300 | $232,600 |
| 2023 | $4,156 | $219,900 | $65,100 | $154,800 |
| 2022 | $4,070 | $219,900 | $65,100 | $154,800 |
| 2021 | $3,958 | $219,900 | $65,100 | $154,800 |
| 2020 | $3,658 | $176,100 | $61,800 | $114,300 |
| 2019 | $3,658 | $176,100 | $61,800 | $114,300 |
| 2018 | $3,573 | $176,100 | $61,800 | $114,300 |
| 2017 | $3,260 | $142,100 | $45,500 | $96,600 |
| 2016 | $3,190 | $142,100 | $45,500 | $96,600 |
| 2015 | $3,190 | $142,100 | $45,500 | $96,600 |
| 2014 | $3,129 | $137,000 | $45,500 | $91,500 |
Source: Public Records
Map
Nearby Homes
Your Personal Tour Guide
Ask me questions while you tour the home.