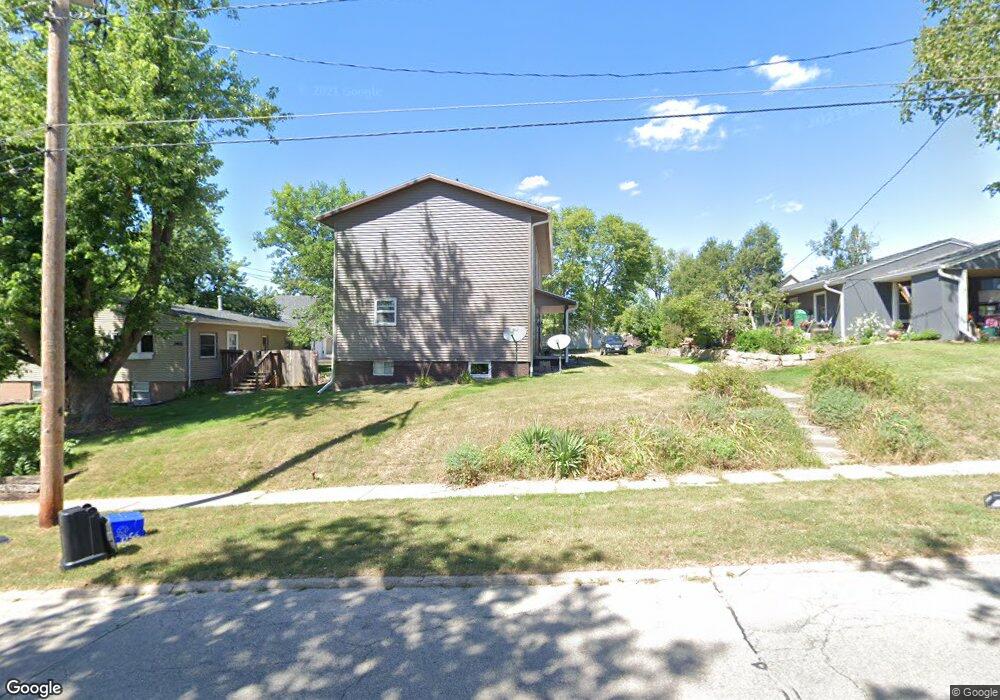
350 3rd Ave Marion, IA 52302
Estimated Value: $211,000 - $247,000
5
Beds
2
Baths
2,208
Sq Ft
$103/Sq Ft
Est. Value
About This Home
This home is located at 350 3rd Ave, Marion, IA 52302 and is currently estimated at $228,159, approximately $103 per square foot. 350 3rd Ave is a home located in Linn County with nearby schools including Starry Elementary School, Francis Marion Intermediate School, and Vernon Middle School.
Ownership History
Date
Name
Owned For
Owner Type
Purchase Details
Closed on
Jul 22, 2021
Sold by
Fosnaugh Thomas P and Fosnaugh Corrine E
Bought by
Eagle Properties Llc
Current Estimated Value
Home Financials for this Owner
Home Financials are based on the most recent Mortgage that was taken out on this home.
Original Mortgage
$328,000
Outstanding Balance
$297,882
Interest Rate
2.96%
Mortgage Type
Purchase Money Mortgage
Estimated Equity
-$69,723
Purchase Details
Closed on
Sep 3, 2014
Sold by
Richardson Properties Llc
Bought by
Fosnaugh Thomas P and Fosnaugh Corrine E
Home Financials for this Owner
Home Financials are based on the most recent Mortgage that was taken out on this home.
Original Mortgage
$110,400
Interest Rate
4.1%
Mortgage Type
New Conventional
Purchase Details
Closed on
Sep 8, 2004
Sold by
Richardson Deane A and Sharp Richardson Gae N
Bought by
Richardson Properties Llc
Purchase Details
Closed on
Jul 1, 2003
Sold by
Mcloy Jennifer L and Mccloy Francis G
Bought by
Richardson Deane A and Sharp Richardson Gae N
Create a Home Valuation Report for This Property
The Home Valuation Report is an in-depth analysis detailing your home's value as well as a comparison with similar homes in the area
Home Values in the Area
Average Home Value in this Area
Purchase History
| Date | Buyer | Sale Price | Title Company |
|---|---|---|---|
| Eagle Properties Llc | $225,000 | None Available | |
| Fosnaugh Thomas P | $138,000 | None Available | |
| Richardson Properties Llc | -- | -- | |
| Richardson Deane A | $124,500 | -- |
Source: Public Records
Mortgage History
| Date | Status | Borrower | Loan Amount |
|---|---|---|---|
| Open | Eagle Properties Llc | $328,000 | |
| Previous Owner | Fosnaugh Thomas P | $110,400 |
Source: Public Records
Tax History Compared to Growth
Tax History
| Year | Tax Paid | Tax Assessment Tax Assessment Total Assessment is a certain percentage of the fair market value that is determined by local assessors to be the total taxable value of land and additions on the property. | Land | Improvement |
|---|---|---|---|---|
| 2025 | $3,886 | $247,400 | $14,200 | $233,200 |
| 2024 | $3,226 | $207,100 | $14,200 | $192,900 |
| 2023 | $3,226 | $207,100 | $14,200 | $192,900 |
| 2022 | $3,100 | $145,000 | $14,200 | $130,800 |
| 2021 | $3,542 | $144,200 | $14,200 | $130,000 |
| 2020 | $3,542 | $156,700 | $14,200 | $142,500 |
| 2019 | $3,326 | $156,700 | $14,200 | $142,500 |
| 2018 | $3,252 | $147,600 | $17,400 | $130,200 |
| 2017 | $3,192 | $140,200 | $18,900 | $121,300 |
| 2016 | $3,192 | $143,500 | $18,900 | $124,600 |
| 2015 | $3,180 | $143,500 | $18,900 | $124,600 |
| 2014 | $3,180 | $143,500 | $18,900 | $124,600 |
| 2013 | $3,058 | $143,500 | $18,900 | $124,600 |
Source: Public Records
Map
Nearby Homes
- 585 5th Ave
- 731 5th Ave
- 103 Merion Blvd
- 112 Merion Blvd
- 245 8th Ave
- 203 Cemar Ct
- 975 6th St
- 937 8th St
- 825 Fairview Dr
- 340 Cemar Ct
- 625 Aircom Dr
- 1663 Luxair Ln
- 1676 Luxair Ln
- 3604 Rueben Dr
- 825 Westview Dr
- 1355 3rd Ave
- 1013 Blairs Ferry R
- 1005 Bridgit Ct SE Unit 7
- 1015 Woodland Heights Ct SE Unit 12
- 305 Valleyview Dr