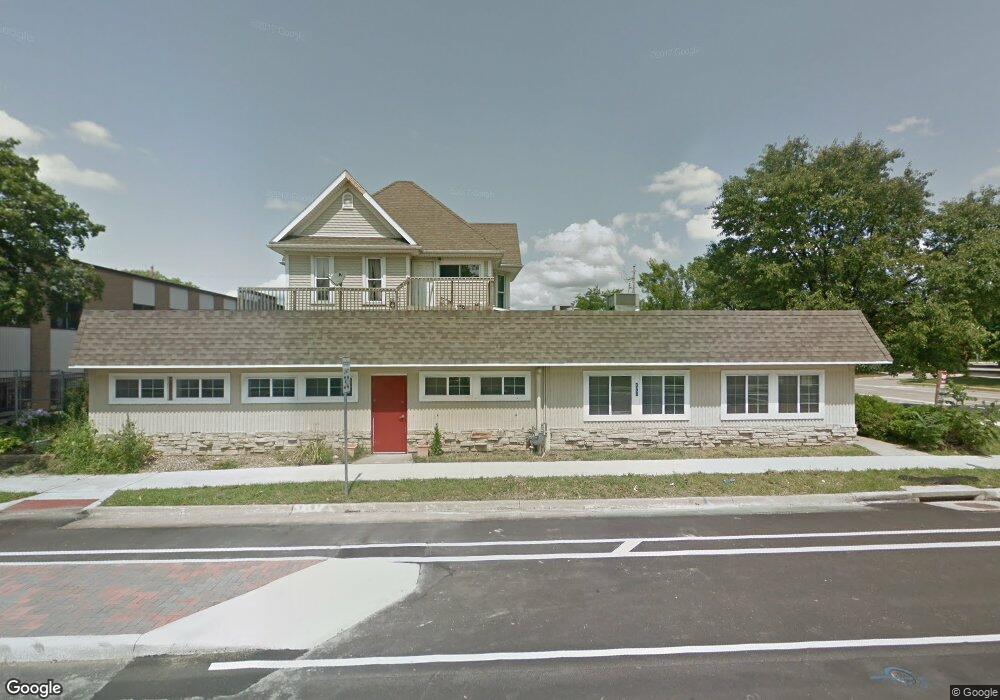
350 3rd Ave SW Cedar Rapids, IA 52404
Taylor NeighborhoodEstimated Value: $253,000 - $347,237
3
Beds
1
Bath
4,880
Sq Ft
$63/Sq Ft
Est. Value
About This Home
This home is located at 350 3rd Ave SW, Cedar Rapids, IA 52404 and is currently estimated at $306,746, approximately $62 per square foot. 350 3rd Ave SW is a home located in Linn County with nearby schools including Junction City Elementary School, Cedar River Academy at Taylor Elementary School, and Bruce Hall Day Treatment Center.
Ownership History
Date
Name
Owned For
Owner Type
Purchase Details
Closed on
Oct 16, 2017
Sold by
Newport Dorothy D and Lanz Elaine
Bought by
Range Homes Llc
Current Estimated Value
Home Financials for this Owner
Home Financials are based on the most recent Mortgage that was taken out on this home.
Original Mortgage
$200,000
Outstanding Balance
$166,877
Interest Rate
3.78%
Mortgage Type
Future Advance Clause Open End Mortgage
Estimated Equity
$139,869
Purchase Details
Closed on
Oct 13, 2017
Sold by
Range Homes Llc
Bought by
Rasmussen Properties Llc
Home Financials for this Owner
Home Financials are based on the most recent Mortgage that was taken out on this home.
Original Mortgage
$200,000
Outstanding Balance
$166,877
Interest Rate
3.78%
Mortgage Type
Future Advance Clause Open End Mortgage
Estimated Equity
$139,869
Purchase Details
Closed on
Jun 5, 2008
Sold by
Big Top Inc
Bought by
Range Homes Llc
Home Financials for this Owner
Home Financials are based on the most recent Mortgage that was taken out on this home.
Original Mortgage
$125,000
Interest Rate
6.01%
Mortgage Type
Commercial
Purchase Details
Closed on
May 10, 2000
Sold by
Haddy George K
Bought by
Licata Rhonda and Haddy Kimberly
Create a Home Valuation Report for This Property
The Home Valuation Report is an in-depth analysis detailing your home's value as well as a comparison with similar homes in the area
Home Values in the Area
Average Home Value in this Area
Purchase History
| Date | Buyer | Sale Price | Title Company |
|---|---|---|---|
| Range Homes Llc | -- | None Available | |
| Rasmussen Properties Llc | -- | None Available | |
| Range Homes Llc | $249,500 | None Available | |
| Licata Rhonda | -- | -- |
Source: Public Records
Mortgage History
| Date | Status | Borrower | Loan Amount |
|---|---|---|---|
| Open | Rasmussen Properties Llc | $200,000 | |
| Previous Owner | Range Homes Llc | $125,000 |
Source: Public Records
Tax History Compared to Growth
Tax History
| Year | Tax Paid | Tax Assessment Tax Assessment Total Assessment is a certain percentage of the fair market value that is determined by local assessors to be the total taxable value of land and additions on the property. | Land | Improvement |
|---|---|---|---|---|
| 2025 | $7,448 | $319,900 | $55,700 | $264,200 |
| 2024 | $6,192 | $315,400 | $55,700 | $259,700 |
| 2023 | $6,192 | $315,400 | $55,700 | $259,700 |
| 2022 | $5,198 | $250,700 | $55,700 | $195,000 |
| 2021 | $5,110 | $243,500 | $55,700 | $187,800 |
| 2020 | $5,110 | $225,000 | $55,700 | $169,300 |
| 2019 | $4,374 | $180,460 | $44,560 | $135,900 |
| 2018 | $6,348 | $180,460 | $44,560 | $135,900 |
| 2017 | $8,794 | $249,060 | $44,560 | $204,500 |
| 2016 | $7,480 | $208,360 | $44,560 | $163,800 |
| 2015 | $7,192 | $209,330 | $55,748 | $153,582 |
| 2014 | $7,192 | $209,330 | $55,748 | $153,582 |
| 2013 | $7,612 | $209,330 | $55,748 | $153,582 |
Source: Public Records
Map
Nearby Homes
- 350 3rd Ave SW Unit 101
- 350 3rd Ave SW Unit 100
- 350 3rd Ave SW Unit 102
- 400 3rd Ave SW
- 415 2nd Ave SW
- 415 2nd Ave SW
- 409 2nd Ave SW
- 421 2nd Ave SW
- 421 2nd Ave SW
- 427 2nd Ave SW
- 433 2nd Ave SW
- 433 2nd Ave SW
- 445 2nd Ave SW
- 439 2nd Ave SW
- 445 2nd Ave SW
- 439 2nd Ave SW
- 403 2nd Ave SW
- 203 Grandville Ln SW
- 3915 Bluebird Dr SW
- 3913 Bluebird Dr SW