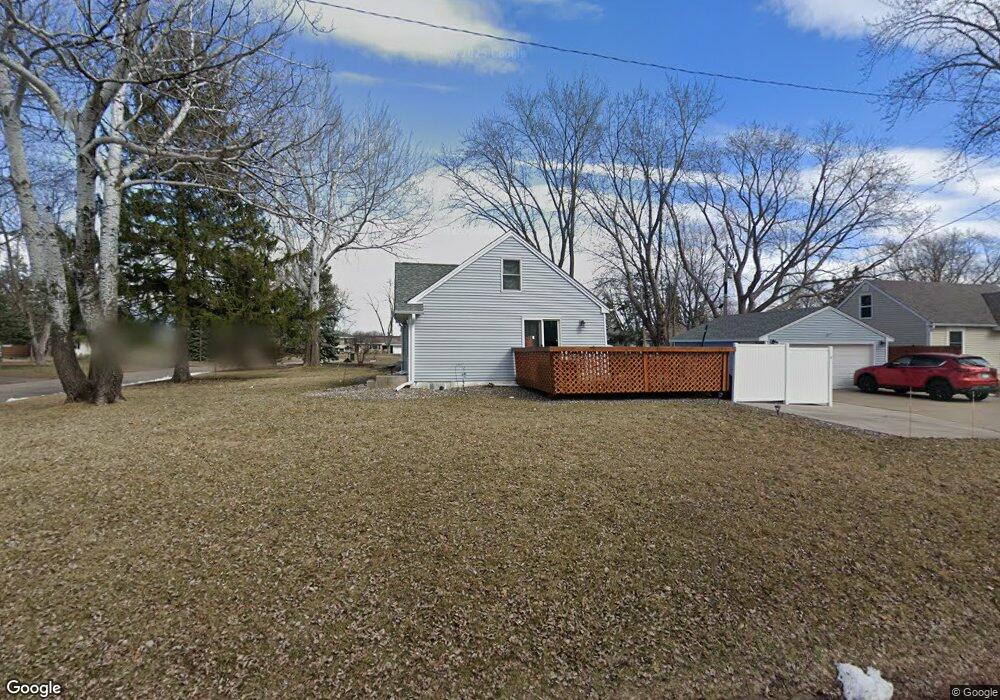
350 93rd Ave NE Minneapolis, MN 55434
Estimated Value: $309,000 - $362,000
4
Beds
2
Baths
1,920
Sq Ft
$174/Sq Ft
Est. Value
About This Home
This home is located at 350 93rd Ave NE, Minneapolis, MN 55434 and is currently estimated at $334,893, approximately $174 per square foot. 350 93rd Ave NE is a home located in Anoka County with nearby schools including Westwood Intermediate and Middle School, Paladin Career & Technical High School, and Cross of Christ Lutheran School.
Ownership History
Date
Name
Owned For
Owner Type
Purchase Details
Closed on
Jun 15, 2021
Sold by
Hpa Ii Borrower 2020 1 Llc
Bought by
Jennings Paul and Jennings Desiree
Current Estimated Value
Home Financials for this Owner
Home Financials are based on the most recent Mortgage that was taken out on this home.
Original Mortgage
$290,331
Outstanding Balance
$262,859
Interest Rate
2.9%
Mortgage Type
FHA
Estimated Equity
$72,034
Purchase Details
Closed on
Jun 4, 2020
Sold by
Hpa Us1 Llc
Bought by
Hpa Ii Borrower 2020 1 Llc
Purchase Details
Closed on
Sep 24, 2019
Sold by
Forga Properties Inc
Bought by
Hpa Us1 Llc
Purchase Details
Closed on
Apr 1, 2009
Sold by
Hud
Bought by
Forga Properties
Purchase Details
Closed on
Nov 15, 2000
Sold by
Kolby David Wayne
Bought by
Dennistoun Sara M
Create a Home Valuation Report for This Property
The Home Valuation Report is an in-depth analysis detailing your home's value as well as a comparison with similar homes in the area
Home Values in the Area
Average Home Value in this Area
Purchase History
| Date | Buyer | Sale Price | Title Company |
|---|---|---|---|
| Jennings Paul | $295,687 | Realtech Title Llc | |
| Hpa Ii Borrower 2020 1 Llc | -- | None Available | |
| Hpa Us1 Llc | $270,000 | Burnet Title | |
| Forga Properties | $49,000 | -- | |
| Dennistoun Sara M | $132,600 | -- | |
| Jennings Paul Paul | $295,700 | -- |
Source: Public Records
Mortgage History
| Date | Status | Borrower | Loan Amount |
|---|---|---|---|
| Open | Jennings Paul | $290,331 |
Source: Public Records
Tax History Compared to Growth
Tax History
| Year | Tax Paid | Tax Assessment Tax Assessment Total Assessment is a certain percentage of the fair market value that is determined by local assessors to be the total taxable value of land and additions on the property. | Land | Improvement |
|---|---|---|---|---|
| 2025 | $3,009 | $286,300 | $110,000 | $176,300 |
| 2024 | $3,009 | $286,800 | $108,200 | $178,600 |
| 2023 | $2,778 | $287,900 | $100,000 | $187,900 |
| 2022 | $2,606 | $285,100 | $86,400 | $198,700 |
| 2021 | $2,686 | $235,500 | $75,000 | $160,500 |
| 2020 | $2,685 | $223,600 | $73,000 | $150,600 |
| 2019 | $2,474 | $213,000 | $68,300 | $144,700 |
| 2018 | $2,316 | $190,400 | $0 | $0 |
| 2017 | $2,149 | $172,400 | $0 | $0 |
| 2016 | $2,127 | $151,900 | $0 | $0 |
| 2015 | -- | $151,900 | $55,500 | $96,400 |
| 2014 | -- | $128,800 | $45,000 | $83,800 |
Source: Public Records
Map
Nearby Homes
- 211 92nd Ave NE
- 191 91st Ln NE
- 663 91st Ave NE
- 161 91st Ave NE
- 403 Pleasure Creek Dr
- 379 95th Ln NE
- 917 94th Ave NE
- 9145 Tyler St NE
- 111 96th Ln NE
- 583 97th Ln NE
- 8730 Jackson St NE
- 877 96th Ave NE
- 8722 Jackson St NE
- 9872 7th St NE
- 484 98th Ln NE
- 9896 Clover Leaf Pkwy NE
- 8709 Able St NE
- 9806 Able St NE
- 10011 Pleasure Creek Cir NE
- XXX Holly St NW
- 360 93rd Ave NE
- 9235 Washington St NE
- 9256 Jefferson St NE
- 9221 Washington St NE
- 9242 Washington St NE
- 9242 Jefferson St NE
- 351 93rd Ave NE
- 361 93rd Ave NE
- 9228 Washington St NE
- 331 93rd Ave NE
- 9214 Washington St NE
- 9228 Jefferson St NE
- 9207 Washington St NE
- 321 93rd Ave NE
- 381 93rd Ave NE
- 9200 Washington St NE
- 9214 Jefferson St NE
- 9163 Washington St NE
- 311 93rd Ave NE
- 9170 Washington St NE