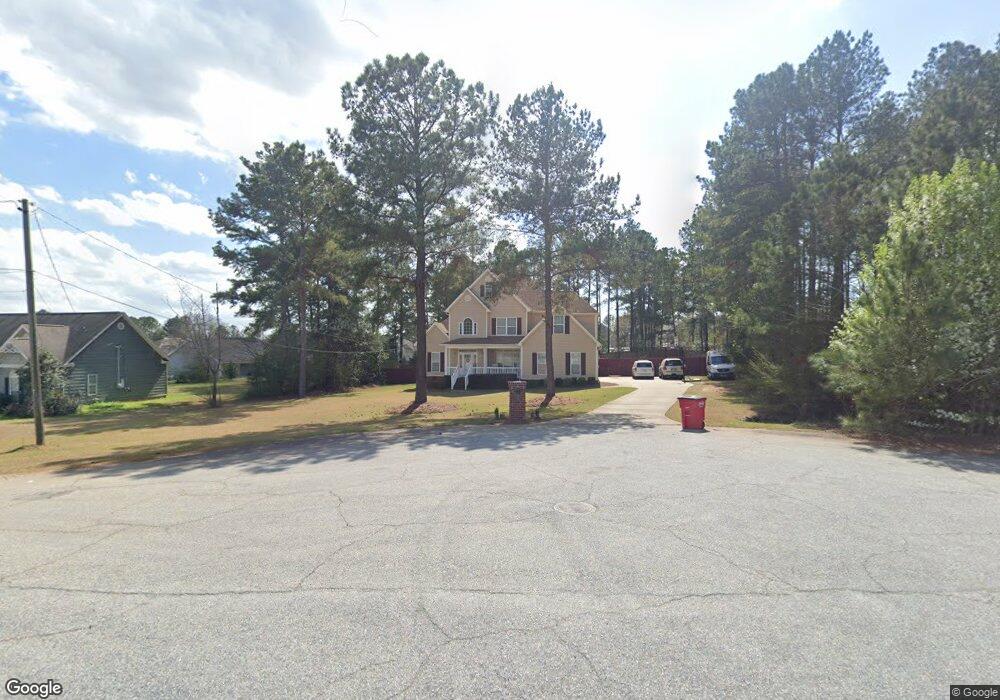
350 Amanda Dr Macon, GA 31216
Estimated Value: $300,000 - $358,025
4
Beds
3
Baths
2,450
Sq Ft
$136/Sq Ft
Est. Value
About This Home
This home is located at 350 Amanda Dr, Macon, GA 31216 and is currently estimated at $333,756, approximately $136 per square foot. 350 Amanda Dr is a home located in Bibb County with nearby schools including Heard Elementary School, Rutland Middle School, and Rutland High School.
Ownership History
Date
Name
Owned For
Owner Type
Purchase Details
Closed on
Jan 1, 2014
Sold by
Action Holdings Llc
Bought by
Liberty Church Development Llc
Current Estimated Value
Purchase Details
Closed on
Sep 29, 2006
Sold by
Logue & Sons Inc
Bought by
Stephens Reco L and Stephens Miyuki L
Home Financials for this Owner
Home Financials are based on the most recent Mortgage that was taken out on this home.
Original Mortgage
$34,000
Interest Rate
6.48%
Mortgage Type
Stand Alone Second
Purchase Details
Closed on
Jun 1, 2006
Sold by
Three Oaks Construction & Development In
Bought by
Logue & Sons Inc
Create a Home Valuation Report for This Property
The Home Valuation Report is an in-depth analysis detailing your home's value as well as a comparison with similar homes in the area
Home Values in the Area
Average Home Value in this Area
Purchase History
| Date | Buyer | Sale Price | Title Company |
|---|---|---|---|
| Liberty Church Development Llc | -- | -- | |
| Stephens Reco L | $170,000 | None Available | |
| Logue & Sons Inc | $25,900 | -- |
Source: Public Records
Mortgage History
| Date | Status | Borrower | Loan Amount |
|---|---|---|---|
| Previous Owner | Stephens Reco L | $34,000 |
Source: Public Records
Tax History Compared to Growth
Tax History
| Year | Tax Paid | Tax Assessment Tax Assessment Total Assessment is a certain percentage of the fair market value that is determined by local assessors to be the total taxable value of land and additions on the property. | Land | Improvement |
|---|---|---|---|---|
| 2025 | $3,316 | $141,934 | $7,360 | $134,574 |
| 2024 | $3,252 | $135,058 | $7,360 | $127,698 |
| 2023 | $2,047 | $105,589 | $7,360 | $98,229 |
| 2022 | $3,231 | $100,332 | $9,200 | $91,132 |
| 2021 | $3,043 | $87,091 | $9,200 | $77,891 |
| 2020 | $2,736 | $77,462 | $7,360 | $70,102 |
| 2019 | $2,606 | $73,567 | $7,360 | $66,207 |
| 2018 | $4,171 | $73,567 | $7,360 | $66,207 |
| 2017 | $2,202 | $65,778 | $7,360 | $58,418 |
| 2016 | $2,034 | $65,778 | $7,360 | $58,418 |
| 2015 | $2,879 | $65,778 | $7,360 | $58,418 |
| 2014 | $2,884 | $65,778 | $7,360 | $58,418 |
Source: Public Records
Map
Nearby Homes