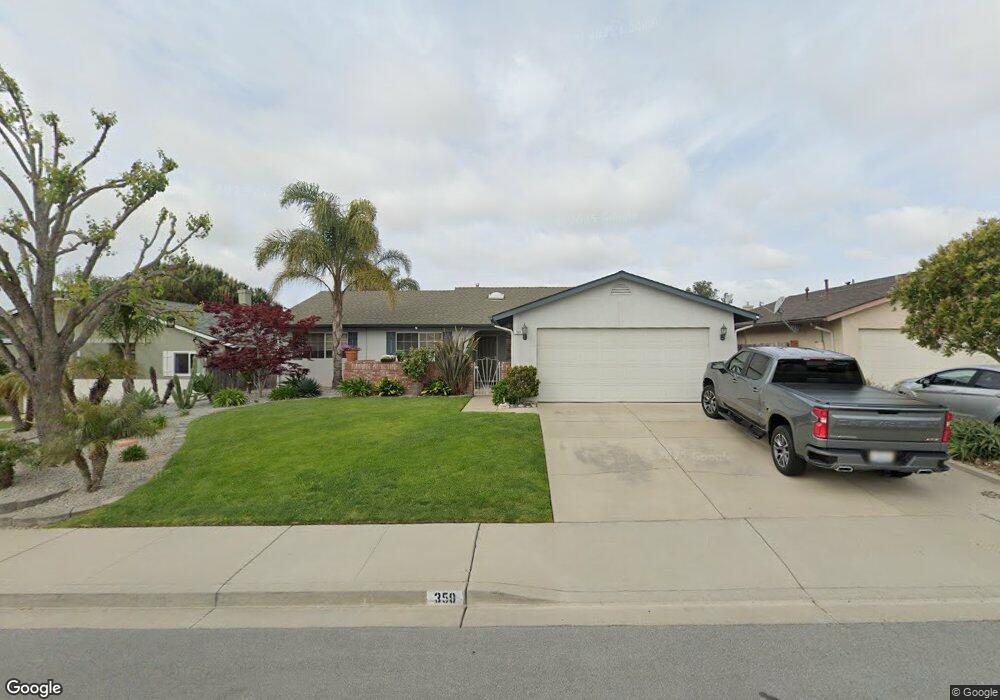
350 Black Hawk Way Nipomo, CA 93444
Estimated Value: $617,000 - $716,000
3
Beds
2
Baths
1,428
Sq Ft
$461/Sq Ft
Est. Value
About This Home
This home is located at 350 Black Hawk Way, Nipomo, CA 93444 and is currently estimated at $658,851, approximately $461 per square foot. 350 Black Hawk Way is a home located in San Luis Obispo County with nearby schools including Dana Elementary School, Mesa Middle School, and Nipomo High School.
Ownership History
Date
Name
Owned For
Owner Type
Purchase Details
Closed on
Oct 25, 2012
Sold by
Mcglothlin Andy
Bought by
Dalton Iva Jean
Current Estimated Value
Purchase Details
Closed on
Apr 5, 2005
Sold by
Mcglothlin Andy and Mcglothlin Nancy S
Bought by
Mcglothlin Andy
Home Financials for this Owner
Home Financials are based on the most recent Mortgage that was taken out on this home.
Original Mortgage
$300,000
Interest Rate
5.77%
Mortgage Type
New Conventional
Purchase Details
Closed on
Feb 27, 2002
Sold by
Hernandez Aurelio M and Hernandez Rosa Ma
Bought by
Hernandez Aurelio M and Hernandez Rosa Maria
Purchase Details
Closed on
May 23, 1995
Sold by
Bonita Homes Inc
Bought by
Mcglothlin Andrew L and Mcglothlin Nancy S
Home Financials for this Owner
Home Financials are based on the most recent Mortgage that was taken out on this home.
Original Mortgage
$140,287
Interest Rate
7.92%
Mortgage Type
FHA
Create a Home Valuation Report for This Property
The Home Valuation Report is an in-depth analysis detailing your home's value as well as a comparison with similar homes in the area
Home Values in the Area
Average Home Value in this Area
Purchase History
We collect this data history from publicly available records. To have your information removed, we recommend requesting removal directly through your county’s website.
| Date | Buyer | Sale Price | Title Company |
|---|---|---|---|
| Dalton Iva Jean | $239,000 | Fidelity National Title Co | |
| Mcglothlin Andy | -- | First American Title Company | |
| Hernandez Aurelio M | -- | -- | |
| Mcglothlin Andrew L | $145,000 | Cuesta Title Guaranty Compan |
Source: Public Records
Mortgage History
We collect this data history from publicly available records. To have your information removed, we recommend requesting removal directly through your county’s website.
| Date | Status | Borrower | Loan Amount |
|---|---|---|---|
| Previous Owner | Mcglothlin Andy | $300,000 | |
| Previous Owner | Mcglothlin Andrew L | $140,287 |
Source: Public Records
Tax History
| Year | Tax Paid | Tax Assessment Tax Assessment Total Assessment is a certain percentage of the fair market value that is determined by local assessors to be the total taxable value of land and additions on the property. | Land | Improvement |
|---|---|---|---|---|
| 2025 | $3,045 | $294,299 | $123,138 | $171,161 |
| 2024 | $3,010 | $288,529 | $120,724 | $167,805 |
| 2023 | $3,010 | $282,872 | $118,357 | $164,515 |
| 2022 | $2,965 | $277,327 | $116,037 | $161,290 |
| 2021 | $2,960 | $271,890 | $113,762 | $158,128 |
| 2020 | $2,926 | $269,103 | $112,596 | $156,507 |
| 2019 | $2,908 | $263,828 | $110,389 | $153,439 |
| 2018 | $2,874 | $258,656 | $108,225 | $150,431 |
| 2017 | $2,821 | $253,585 | $106,103 | $147,482 |
| 2016 | $2,661 | $248,614 | $104,023 | $144,591 |
| 2015 | $2,623 | $244,881 | $102,461 | $142,420 |
| 2014 | $2,527 | $240,085 | $100,454 | $139,631 |
Source: Public Records
Map
Nearby Homes
- 236 Scarlett Cir
- 224 Scarlett Cir
- 680 Hill St
- 719 W Tefft St
- 245 Hazel Ln
- 181 Jerome Ct
- 361 Jupiter Dr
- 549 Hill St
- 545 Grande St
- 778 Primrose Ln
- 785 Bracken Ln
- 525 Grande Ave
- 511 Avenida Montecito Verde
- 429 Saturn Ct
- 461 Saturn Ct
- 187 Amaranth Ln
- 468 Neptune Dr
- 379 Mars Ct
- 184 Alyssum Cir
- 228 Chaparral Ln
- 345 Kestrel Way
- 335 Kestrel Way
- 355 Kestrel Way
- 340 Black Hawk Way
- 330 Black Hawk Way
- 325 Kestrel Way
- 365 Kestrel Way
- 340 Kestrel Way
- 360 Black Hawk Way
- 320 Black Hawk Way
- 350 Kestrel Way
- 320 Kestrel Way
- 360 Kestrel Way
- 370 Black Hawk Way
- 370 Kestrel Way
- 830 Peregrine Ln
- 335 Black Hawk Way
- 840 Peregrine Ln
- 820 Peregrine Ln
- 355 Black Hawk Way
Your Personal Tour Guide
Ask me questions while you tour the home.