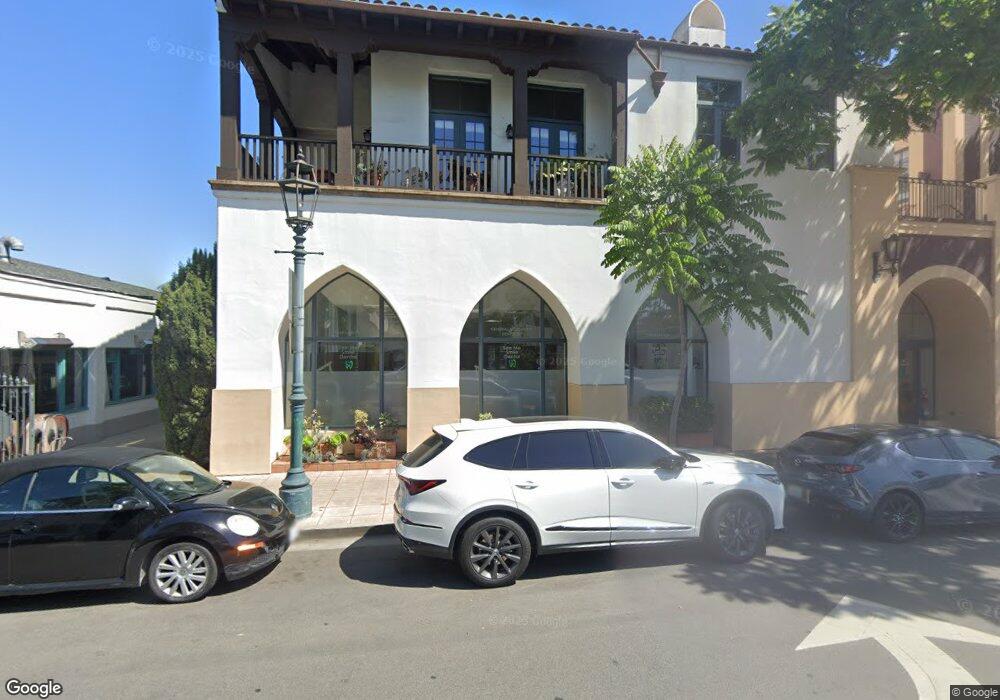
350 Chapala St Unit R15PH Santa Barbara, CA 93101
Estimated Value: $2,769,000 - $2,809,420
1
Bed
2
Baths
1,816
Sq Ft
$1,536/Sq Ft
Est. Value
About This Home
This home is located at 350 Chapala St Unit R15PH, Santa Barbara, CA 93101 and is currently estimated at $2,790,140, approximately $1,536 per square foot. 350 Chapala St Unit R15PH is a home located in Santa Barbara County with nearby schools including La Cumbre Junior High School, San Marcos Senior High School, and Providence School.
Ownership History
Date
Name
Owned For
Owner Type
Purchase Details
Closed on
Sep 20, 2023
Sold by
Kay R Mcmillan Qualified Personal Reside
Bought by
Ballard Lynda and Mcmillan Susan A
Current Estimated Value
Purchase Details
Closed on
Sep 19, 2011
Sold by
Mcmillan Kay R
Bought by
Mcmillan Kay R
Purchase Details
Closed on
Jun 28, 2005
Sold by
Hughes Donald A and Hughes Lucinda B
Bought by
Mcmillan Kay R
Purchase Details
Closed on
Dec 2, 2002
Sold by
Hughes Donald A
Bought by
Hughes Donald A and Hughes Lucinda B
Purchase Details
Closed on
Oct 11, 2002
Sold by
Hughes Lucinda B
Bought by
Hughes Donald A
Home Financials for this Owner
Home Financials are based on the most recent Mortgage that was taken out on this home.
Original Mortgage
$990,000
Interest Rate
4.87%
Mortgage Type
Purchase Money Mortgage
Purchase Details
Closed on
Sep 11, 2002
Sold by
Chapala Lofts Lp
Bought by
Hughes Donald A
Home Financials for this Owner
Home Financials are based on the most recent Mortgage that was taken out on this home.
Original Mortgage
$990,000
Interest Rate
4.87%
Mortgage Type
Purchase Money Mortgage
Create a Home Valuation Report for This Property
The Home Valuation Report is an in-depth analysis detailing your home's value as well as a comparison with similar homes in the area
Home Values in the Area
Average Home Value in this Area
Purchase History
| Date | Buyer | Sale Price | Title Company |
|---|---|---|---|
| Ballard Lynda | -- | None Listed On Document | |
| Mcmillan Kay R | -- | None Available | |
| Mcmillan Kay R | $2,150,000 | First American Title Company | |
| Hughes Donald A | -- | -- | |
| Hughes Donald A | -- | Fidelity National Title Co | |
| Hughes Donald A | $1,320,000 | Fidelity National Title Co |
Source: Public Records
Mortgage History
| Date | Status | Borrower | Loan Amount |
|---|---|---|---|
| Previous Owner | Hughes Donald A | $990,000 |
Source: Public Records
Tax History Compared to Growth
Tax History
| Year | Tax Paid | Tax Assessment Tax Assessment Total Assessment is a certain percentage of the fair market value that is determined by local assessors to be the total taxable value of land and additions on the property. | Land | Improvement |
|---|---|---|---|---|
| 2025 | $34,758 | $3,315,000 | $1,657,500 | $1,657,500 |
| 2023 | $34,758 | $2,843,754 | $1,313,514 | $1,530,240 |
| 2022 | $29,626 | $2,787,995 | $1,287,759 | $1,500,236 |
| 2021 | $26,967 | $2,546,000 | $1,184,000 | $1,362,000 |
| 2020 | $24,512 | $2,314,000 | $1,076,000 | $1,238,000 |
| 2019 | $24,566 | $2,314,000 | $1,076,000 | $1,238,000 |
| 2018 | $24,223 | $2,269,000 | $1,055,000 | $1,214,000 |
| 2017 | $22,756 | $2,161,000 | $1,005,000 | $1,156,000 |
| 2016 | $21,549 | $2,058,000 | $957,000 | $1,101,000 |
| 2014 | $18,809 | $1,782,000 | $828,000 | $954,000 |
Source: Public Records
Map
Nearby Homes
- 401 Chapala St Unit 111
- 401 Chapala St Unit 214
- 124 W Yanonali St
- 134 Chapala
- 517 Brinkerhoff Ave
- 519 Brinkerhoff Ave
- 111 Chapala St
- 618 Anacapa St Unit 5
- 218 Santa Barbara St Unit D
- 415 W Gutierrez St Unit 11
- 220 Santa Barbara St Unit C
- 105 W De la Guerra St Unit S
- 324 W Cabrillo Blvd
- 521 W Montecito St Unit 4
- 325 Ladera St Unit 5
- 0 Santa Barbara Harbor Unit Marina 3c, Slip St-1
- 330 W Canon Perdido St
- 575 E Montecito St
- 618 Olive St
- 0 Santa Barbara Harbor Marina 3c Slip St-13 Unit 25566593
- 350 Chapala St Unit 207
- 350 Chapala Unit 213 St
- 350 Chapala Unit 206 St
- 350 Chapala St Unit 208
- 350 Chapala St Unit 213
- 350 Chapala St Unit 302
- 350 Chapala St Unit 206
- 350 Chapala St Unit 103
- 350 Chapala St Unit 210
- 350 Chapala St Unit 104
- 350 Chapala St Unit D
- 350 Chapala St Unit A
- 350 Chapala St Unit 212
- 350 Chapala St Unit R16PH
- 350 Chapala St
- 350 Chapala St Unit R13LA
- 350 Chapala St Unit R12LA
- 350 Chapala St Unit R11LA
- 350 Chapala St Unit R10LA
- 350 Chapala St Unit R9LA