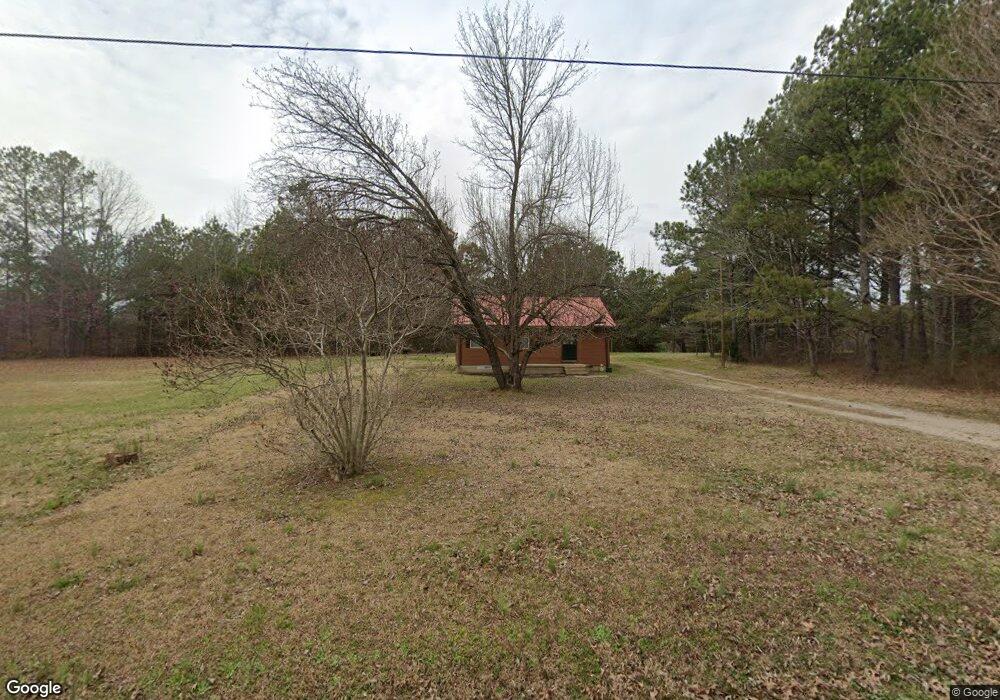
350 Damron Loop Counce, TN 38326
Estimated Value: $87,058 - $156,000
2
Beds
1
Bath
889
Sq Ft
$141/Sq Ft
Est. Value
About This Home
This home is located at 350 Damron Loop, Counce, TN 38326 and is currently estimated at $125,515, approximately $141 per square foot. 350 Damron Loop is a home located in Hardin County with nearby schools including Hardin County High School.
Ownership History
Date
Name
Owned For
Owner Type
Purchase Details
Closed on
Feb 4, 2025
Sold by
Reeves Verma L
Bought by
Hearn Lisa D
Current Estimated Value
Purchase Details
Closed on
Dec 15, 2010
Sold by
Barnes Michael
Bought by
Reeves Verma L
Home Financials for this Owner
Home Financials are based on the most recent Mortgage that was taken out on this home.
Original Mortgage
$57,504
Interest Rate
4.25%
Mortgage Type
FHA
Purchase Details
Closed on
Jan 27, 2010
Sold by
Hamilton Evelyn
Bought by
Barnes Michael
Purchase Details
Closed on
Dec 8, 2009
Sold by
Littlejohn Roy M
Bought by
Hamilton Evelyn
Purchase Details
Closed on
May 11, 2009
Sold by
Jones Jody
Bought by
Littlejohn Roy M
Purchase Details
Closed on
Feb 16, 1990
Bought by
Jones Jody and Jones Glenna
Purchase Details
Closed on
Oct 7, 1966
Bought by
Mayhall John and Mayhall Dulcie
Create a Home Valuation Report for This Property
The Home Valuation Report is an in-depth analysis detailing your home's value as well as a comparison with similar homes in the area
Purchase History
| Date | Buyer | Sale Price | Title Company |
|---|---|---|---|
| Hearn Lisa D | -- | None Listed On Document | |
| Hearn Lisa D | -- | None Listed On Document | |
| Reeves Verma L | $59,000 | -- | |
| Barnes Michael | $13,500 | -- | |
| Hamilton Evelyn | $12,000 | -- | |
| Littlejohn Roy M | $15,000 | -- | |
| Jones Jody | -- | -- | |
| Mayhall John | -- | -- |
Source: Public Records
Mortgage History
| Date | Status | Borrower | Loan Amount |
|---|---|---|---|
| Previous Owner | Reeves Verma L | $57,504 |
Source: Public Records
Tax History
| Year | Tax Paid | Tax Assessment Tax Assessment Total Assessment is a certain percentage of the fair market value that is determined by local assessors to be the total taxable value of land and additions on the property. | Land | Improvement |
|---|---|---|---|---|
| 2025 | $361 | $20,650 | $1,500 | $19,150 |
| 2024 | $361 | $20,650 | $1,500 | $19,150 |
| 2023 | $361 | $20,650 | $1,500 | $19,150 |
| 2022 | $263 | $12,750 | $775 | $11,975 |
| 2021 | $263 | $12,750 | $775 | $11,975 |
| 2020 | $263 | $12,750 | $775 | $11,975 |
| 2019 | $263 | $12,750 | $775 | $11,975 |
| 2018 | $254 | $12,750 | $775 | $11,975 |
| 2017 | $268 | $12,900 | $775 | $12,125 |
| 2016 | $268 | $12,900 | $775 | $12,125 |
| 2015 | $235 | $12,900 | $775 | $12,125 |
| 2014 | $235 | $12,900 | $775 | $12,125 |
Source: Public Records
Map
Nearby Homes
- 105 Fiesta Cove
- 725 Crow Ln
- 675 Kimberly Ln
- 85 Aunt Bee Rd
- 0 Leath Rd
- 0 Leath Rd Unit LotWP001 24553817
- 0 Carroll Road - Lot 6
- 0 Carroll Road - Lot 7
- 00 Kendrick & Hamburg Rd
- 330 Lick Creek Rd
- 0 Hwy 57 Hwy Unit RTC3043276
- 6140 Tennessee 57
- 410 Gladden Rd
- 10785 Tennessee 57
- 330 Nash Landing Ln
- 5205 Hamburg Rd
- 0 Baxter Rd
- 0 Yeager Ln Unit 10179905
- 715 Arnold Ln
- 20 Doodle Cove
- 333 Damron Loop
- 312 Damron Loop
- 385 Damron Loop
- 255 Damron Loop
- 1 Damron Loop
- 555 Damron Loop
- 555 Damron Loop
- 180 Damron Loop
- 158 Damron Loop
- 155 Damron Loop
- 136 Damron Loop
- 135 Damron Loop
- 2840 Highway 57
- 848 Damron Loop
- 810 Damron Loop
- 645 Damron Loop
- 645 Damron Loop
- 741 Damron Loop
- 685 Damron Loop
- 886 Damron Loop
Your Personal Tour Guide
Ask me questions while you tour the home.