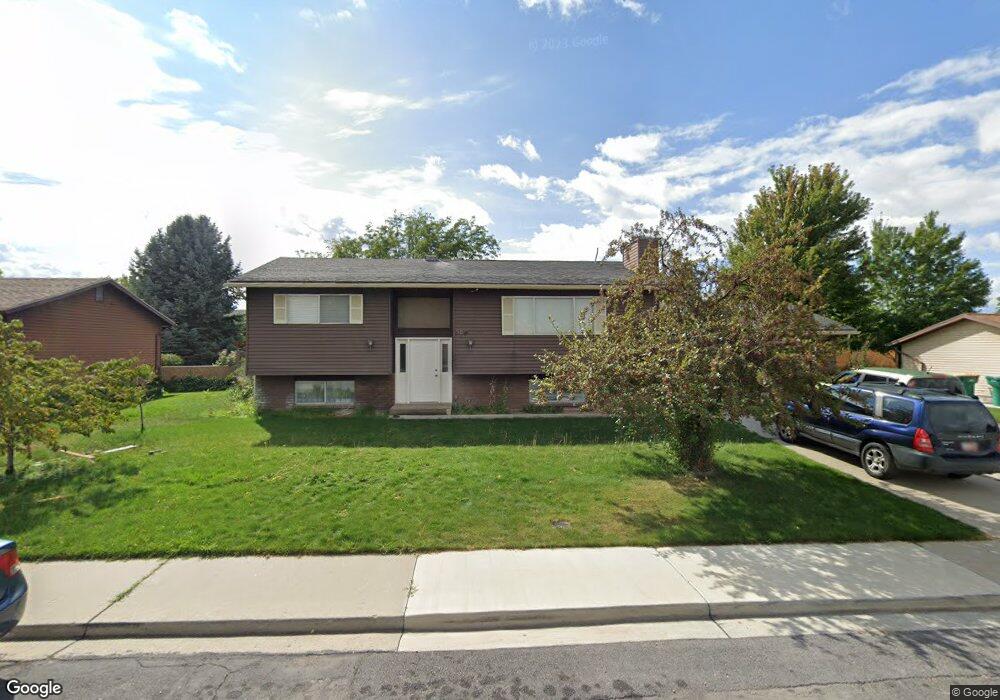
350 E 1090 N Orem, UT 84057
Windsor NeighborhoodEstimated Value: $487,000 - $584,000
4
Beds
2
Baths
1,976
Sq Ft
$263/Sq Ft
Est. Value
About This Home
This home is located at 350 E 1090 N, Orem, UT 84057 and is currently estimated at $518,880, approximately $262 per square foot. 350 E 1090 N is a home located in Utah County with nearby schools including Orchard Elementary School, Canyon View Junior High School, and Timpanogos High School.
Ownership History
Date
Name
Owned For
Owner Type
Purchase Details
Closed on
Jul 20, 2017
Sold by
Fielding John R H
Bought by
Lucas Shawn and Lucas Tricia
Current Estimated Value
Purchase Details
Closed on
Aug 25, 2011
Sold by
Fielding Justine M and Fielding John R H
Bought by
Fielding John R H
Home Financials for this Owner
Home Financials are based on the most recent Mortgage that was taken out on this home.
Original Mortgage
$130,100
Interest Rate
4.48%
Purchase Details
Closed on
Jul 17, 2001
Sold by
Fielding Robert K and Fielding Dorothy S
Bought by
Fielding John R H and Fielding Justine M
Home Financials for this Owner
Home Financials are based on the most recent Mortgage that was taken out on this home.
Original Mortgage
$101,750
Interest Rate
7.21%
Create a Home Valuation Report for This Property
The Home Valuation Report is an in-depth analysis detailing your home's value as well as a comparison with similar homes in the area
Home Values in the Area
Average Home Value in this Area
Purchase History
| Date | Buyer | Sale Price | Title Company |
|---|---|---|---|
| Lucas Shawn | -- | Lydolph & Weierholt Title In | |
| Fielding John R H | -- | Metro National Title | |
| Fielding John R H | -- | Mountain West Title Co |
Source: Public Records
Mortgage History
| Date | Status | Borrower | Loan Amount |
|---|---|---|---|
| Previous Owner | Fielding John R H | $130,100 | |
| Previous Owner | Fielding John R H | $101,750 |
Source: Public Records
Tax History
| Year | Tax Paid | Tax Assessment Tax Assessment Total Assessment is a certain percentage of the fair market value that is determined by local assessors to be the total taxable value of land and additions on the property. | Land | Improvement |
|---|---|---|---|---|
| 2025 | $2,098 | $266,200 | -- | -- |
| 2024 | $2,098 | $256,575 | $0 | $0 |
| 2023 | $1,962 | $257,895 | $0 | $0 |
| 2022 | $2,011 | $256,025 | $0 | $0 |
| 2021 | $1,697 | $327,300 | $141,900 | $185,400 |
| 2020 | $1,558 | $295,300 | $113,500 | $181,800 |
| 2019 | $1,387 | $273,300 | $102,900 | $170,400 |
| 2018 | $1,354 | $254,900 | $99,300 | $155,600 |
| 2017 | $1,245 | $125,620 | $0 | $0 |
| 2016 | $1,249 | $116,215 | $0 | $0 |
| 2015 | $1,163 | $102,355 | $0 | $0 |
| 2014 | $1,143 | $100,100 | $0 | $0 |
Source: Public Records
Map
Nearby Homes
- 372 E 1165 N
- 917 N Garden Dr
- 976 N 560 E
- 362 E 800 N Unit 1
- 789 200 E Unit 787
- 1371 N 330 E Unit 8
- 16 E 925 N
- 471 E 700 N
- 363 E 1395 N Unit 22
- 710 E 1280 N
- 1480 N 430 E
- 723 E 1450 N Unit 25
- 620 N 120 E
- 125 W 870 N
- 713 E 1450 N Unit 23
- 733 E 1450 N Unit 5
- 1324 N 750 E Unit 3
- 713 E 1500 St N Unit 19
- 1356 N 750 E Unit 11
- 1366 N 750 E
Your Personal Tour Guide
Ask me questions while you tour the home.