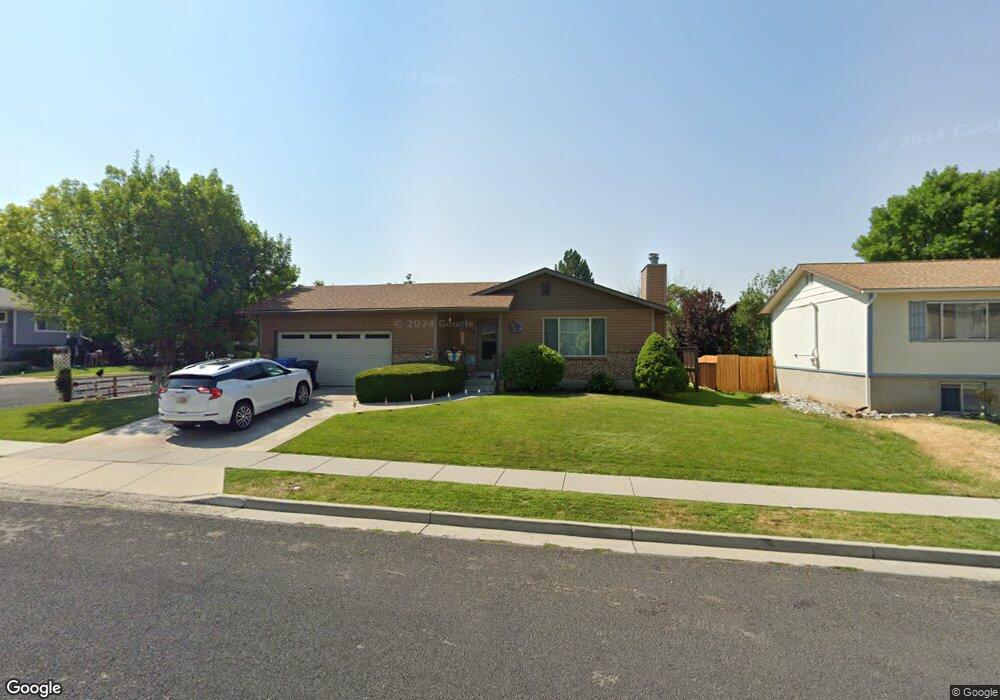
350 E 1200 N Logan, UT 84341
Adams NeighborhoodEstimated Value: $423,000 - $442,000
4
Beds
2
Baths
2,655
Sq Ft
$164/Sq Ft
Est. Value
About This Home
This home is located at 350 E 1200 N, Logan, UT 84341 and is currently estimated at $435,305, approximately $163 per square foot. 350 E 1200 N is a home located in Cache County with nearby schools including Adams Elementary School, Mount Logan Middle School, and Logan High School.
Ownership History
Date
Name
Owned For
Owner Type
Purchase Details
Closed on
Jul 26, 2021
Sold by
Errol Woolsey Dennis
Bought by
Woolsey Sheila R
Current Estimated Value
Purchase Details
Closed on
May 12, 2016
Sold by
Woolsey Dennis E and Woolsey Sheila R
Bought by
The Dennis E Woolsey & Sheila R Woolsey and Woolsey Sheila R
Purchase Details
Closed on
Jun 21, 2008
Sold by
Gilger Sharon L and Gittins Deborah L
Bought by
Woolsey Dennis E and Woolsey Sheila R
Purchase Details
Closed on
May 9, 2008
Sold by
Gilger Sharon L and Gittins Deborah L
Bought by
Gilger Sharon L and Gittins Deborah L
Create a Home Valuation Report for This Property
The Home Valuation Report is an in-depth analysis detailing your home's value as well as a comparison with similar homes in the area
Home Values in the Area
Average Home Value in this Area
Purchase History
| Date | Buyer | Sale Price | Title Company |
|---|---|---|---|
| Woolsey Sheila R | -- | -- | |
| The Dennis E Woolsey & Sheila R Woolsey | -- | None Available | |
| Woolsey Dennis E | -- | Heritage Title | |
| Gilger Sharon L | -- | None Available |
Source: Public Records
Tax History
| Year | Tax Paid | Tax Assessment Tax Assessment Total Assessment is a certain percentage of the fair market value that is determined by local assessors to be the total taxable value of land and additions on the property. | Land | Improvement |
|---|---|---|---|---|
| 2025 | $1,856 | $240,010 | $0 | $0 |
| 2023 | $1,999 | $238,635 | $0 | $0 |
| 2022 | $1,770 | $197,385 | $0 | $0 |
| 2021 | $1,670 | $287,600 | $50,000 | $237,600 |
| 2020 | $1,600 | $248,000 | $50,000 | $198,000 |
| 2019 | $1,488 | $220,750 | $50,000 | $170,750 |
| 2018 | $1,438 | $194,704 | $50,000 | $144,704 |
| 2017 | $1,315 | $94,160 | $0 | $0 |
| 2016 | $1,363 | $94,160 | $0 | $0 |
| 2015 | $1,365 | $94,160 | $0 | $0 |
| 2014 | $1,211 | $92,435 | $0 | $0 |
| 2013 | -- | $92,435 | $0 | $0 |
Source: Public Records
Map
Nearby Homes
- 359 E 1075 N
- 1007 Bonneville Ave
- 252 E 1000 N
- 1188 N 600 E
- 633 E 1260 N
- 648 E 1280 N
- 1177 N 680 E
- 1167 N 680 E
- 643 E 1280 N
- 1238 E Talmage Ln Unit 33
- 1366 N Talmage Ln Unit 35
- 1367 E 1280 N
- 1261 E Talmage Ln Unit 59
- 1241 E Talmage Ln Unit 31
- 1246 E Talmage Ln Unit 32
- 395 E 1530 N
- 239 E 1530 N
- 55 Heritage Cove
- 871 N 700 E
- 732 N 500 E
Your Personal Tour Guide
Ask me questions while you tour the home.