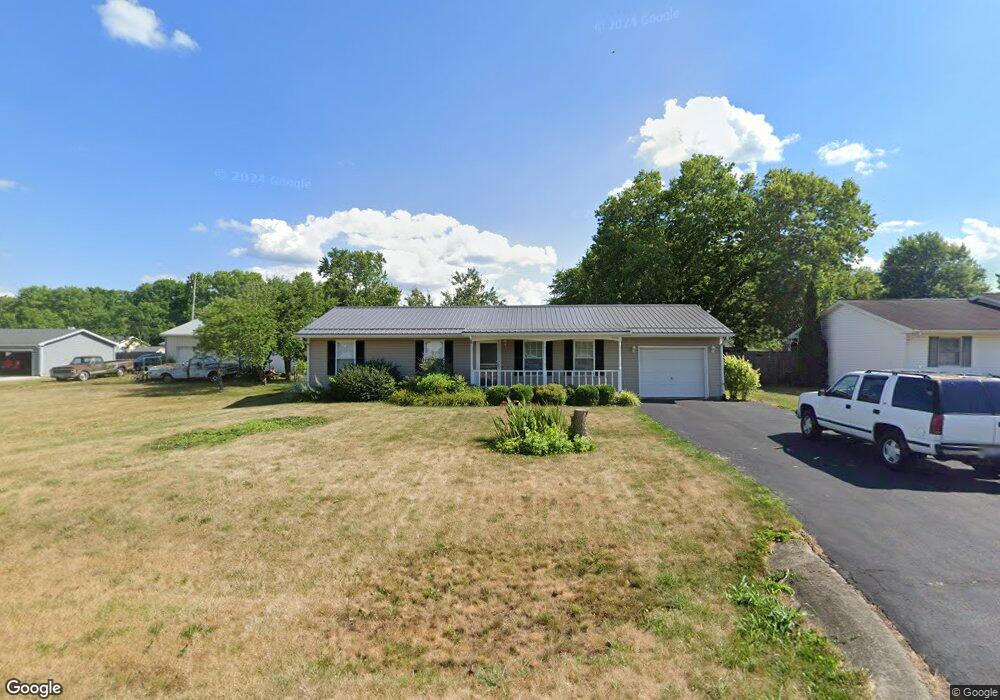
350 Franklin Cir Chillicothe, OH 45601
Estimated Value: $157,000 - $238,000
3
Beds
2
Baths
1,056
Sq Ft
$195/Sq Ft
Est. Value
About This Home
This home is located at 350 Franklin Cir, Chillicothe, OH 45601 and is currently estimated at $206,232, approximately $195 per square foot. 350 Franklin Cir is a home located in Ross County with nearby schools including Paint Valley Elementary School, Paint Valley Middle School, and Paint Valley High School.
Ownership History
Date
Name
Owned For
Owner Type
Purchase Details
Closed on
Sep 7, 2023
Sold by
Matter Tancy M and Matter Graham
Bought by
Phillips Aaron M
Current Estimated Value
Home Financials for this Owner
Home Financials are based on the most recent Mortgage that was taken out on this home.
Original Mortgage
$140,000
Outstanding Balance
$137,624
Interest Rate
8.13%
Mortgage Type
New Conventional
Estimated Equity
$68,608
Purchase Details
Closed on
May 25, 2007
Sold by
Hinty Paul D
Bought by
Reese Tancy M
Home Financials for this Owner
Home Financials are based on the most recent Mortgage that was taken out on this home.
Original Mortgage
$109,000
Interest Rate
6.22%
Mortgage Type
Purchase Money Mortgage
Create a Home Valuation Report for This Property
The Home Valuation Report is an in-depth analysis detailing your home's value as well as a comparison with similar homes in the area
Home Values in the Area
Average Home Value in this Area
Purchase History
| Date | Buyer | Sale Price | Title Company |
|---|---|---|---|
| Phillips Aaron M | $155,000 | Chicago Title | |
| Phillips Aaron M | $155,000 | Chicago Title | |
| Reese Tancy M | $109,000 | Title First Agency |
Source: Public Records
Mortgage History
| Date | Status | Borrower | Loan Amount |
|---|---|---|---|
| Open | Phillips Aaron M | $140,000 | |
| Closed | Phillips Aaron M | $140,000 | |
| Previous Owner | Reese Tancy M | $109,000 |
Source: Public Records
Tax History Compared to Growth
Tax History
| Year | Tax Paid | Tax Assessment Tax Assessment Total Assessment is a certain percentage of the fair market value that is determined by local assessors to be the total taxable value of land and additions on the property. | Land | Improvement |
|---|---|---|---|---|
| 2024 | $1,643 | $45,590 | $7,010 | $38,580 |
| 2023 | $1,643 | $45,590 | $7,010 | $38,580 |
| 2022 | $1,609 | $45,590 | $7,010 | $38,580 |
| 2021 | $1,697 | $45,010 | $6,940 | $38,070 |
| 2020 | $1,699 | $45,010 | $6,940 | $38,070 |
| 2019 | $1,684 | $45,010 | $6,940 | $38,070 |
| 2018 | $1,565 | $40,690 | $6,940 | $33,750 |
| 2017 | $1,567 | $40,690 | $6,940 | $33,750 |
| 2016 | $1,527 | $40,690 | $6,940 | $33,750 |
| 2015 | $1,513 | $40,360 | $6,940 | $33,420 |
| 2014 | $1,476 | $40,360 | $6,940 | $33,420 |
| 2013 | $1,501 | $40,360 | $6,940 | $33,420 |
Source: Public Records
Map
Nearby Homes
- 102 Franklin Cir
- 263 Queen Dr
- 313 Goodale Dr
- 54 Moccasin Dr
- 365 Golfview Dr
- 559 Golfview Dr
- 2083 Anderson Station Rd
- 70 W Patrician Ct
- 18 Sarah Ct
- 320 Summerhill Dr
- 11303 County Road 550
- 435 Mount Carmel Rd
- 420 Steiner Rd
- 12690 Pleasant Valley Rd
- 2719 Sulphur Lick Rd
- 13223 Pleasant Valley Rd
- 155 Steiner Rd
- 310 Almahurst Dr
- 88 Fruit Hill Dr
- 63 Page Rd