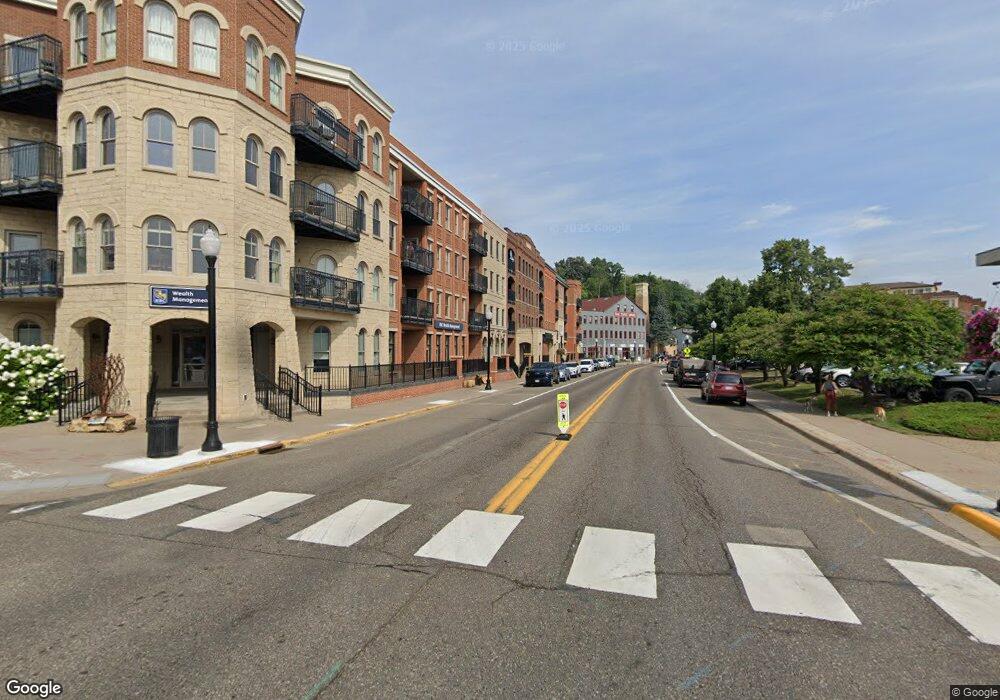
350 Main St N Unit 346 Stillwater, MN 55082
Estimated Value: $449,000 - $503,000
1
Bed
2
Baths
1,057
Sq Ft
$449/Sq Ft
Est. Value
About This Home
This home is located at 350 Main St N Unit 346, Stillwater, MN 55082 and is currently estimated at $474,383, approximately $448 per square foot. 350 Main St N Unit 346 is a home located in Washington County with nearby schools including Stonebridge Elementary School, Stillwater Middle School, and Stillwater Area High School.
Ownership History
Date
Name
Owned For
Owner Type
Purchase Details
Closed on
May 16, 2022
Sold by
Murray Cameron T and Revo Renee
Bought by
Cartier Cecelia P
Current Estimated Value
Home Financials for this Owner
Home Financials are based on the most recent Mortgage that was taken out on this home.
Original Mortgage
$326,250
Outstanding Balance
$310,069
Interest Rate
5.3%
Mortgage Type
New Conventional
Estimated Equity
$164,314
Purchase Details
Closed on
Sep 10, 2013
Sold by
Bjorkman Kenneth and Bjorkman Laura
Bought by
Murray Cameron T and Murray Renee M
Home Financials for this Owner
Home Financials are based on the most recent Mortgage that was taken out on this home.
Original Mortgage
$176,000
Interest Rate
4.39%
Mortgage Type
New Conventional
Create a Home Valuation Report for This Property
The Home Valuation Report is an in-depth analysis detailing your home's value as well as a comparison with similar homes in the area
Home Values in the Area
Average Home Value in this Area
Purchase History
| Date | Buyer | Sale Price | Title Company |
|---|---|---|---|
| Cartier Cecelia P | $435,000 | None Listed On Document | |
| Murray Cameron T | $220,000 | Burnet Title |
Source: Public Records
Mortgage History
| Date | Status | Borrower | Loan Amount |
|---|---|---|---|
| Open | Cartier Cecelia P | $326,250 | |
| Previous Owner | Murray Cameron T | $176,000 |
Source: Public Records
Tax History Compared to Growth
Tax History
| Year | Tax Paid | Tax Assessment Tax Assessment Total Assessment is a certain percentage of the fair market value that is determined by local assessors to be the total taxable value of land and additions on the property. | Land | Improvement |
|---|---|---|---|---|
| 2024 | $5,214 | $452,200 | $290,000 | $162,200 |
| 2023 | $5,214 | $409,200 | $239,000 | $170,200 |
| 2022 | $3,778 | $361,800 | $211,300 | $150,500 |
| 2021 | $3,564 | $316,500 | $183,300 | $133,200 |
| 2020 | $3,522 | $308,200 | $181,300 | $126,900 |
| 2019 | $3,034 | $300,500 | $164,800 | $135,700 |
| 2018 | $2,812 | $244,900 | $121,800 | $123,100 |
| 2017 | $2,456 | $226,800 | $105,000 | $121,800 |
| 2016 | $2,346 | $205,000 | $85,000 | $120,000 |
| 2015 | $2,330 | $178,100 | $67,600 | $110,500 |
| 2013 | -- | $165,100 | $61,600 | $103,500 |
Source: Public Records
Map
Nearby Homes
- 501 Main St N Unit 202
- 501 Main St N Unit 222
- 610 Main St N Unit 305
- 620 Main St N Unit 114
- 640 Main St N Unit 42
- 640 Main St N Unit 37
- 406 Mulberry St W
- 809 5th St N
- 451 Everett St N
- 109 Pine St E
- 418 Holcombe St S
- 918 William St N
- 610 Wilkins St W
- 609 Willard St W
- 211 Olive St W
- 308 4th St S
- 818 7th St S
- 721 Martha St S
- 1311 Meadowlark Dr
- 935 6th Ave S
- 350 Main St N Unit 362
- 350 Main St N Unit 222
- 350 Main St N Unit 404
- 350 Main St N Unit 242
- 350 Main St N Unit 300
- 350 Main St N Unit 444
- 350 Main St N Unit 310
- 350 Main St N Unit 338
- 350 Main St N Unit 456
- 350 Main St N Unit 426
- 350 Main St N Unit 246
- 350 Main St N Unit 400
- 350 Main St N Unit 334
- 350 Main St N Unit 236
- 350 Main St N Unit 436
- 350 Main St N Unit 433
- 350 Main St N Unit 316
- 350 Main St N Unit 258
- 350 Main St N Unit 448
- 350 Main St N Unit 460