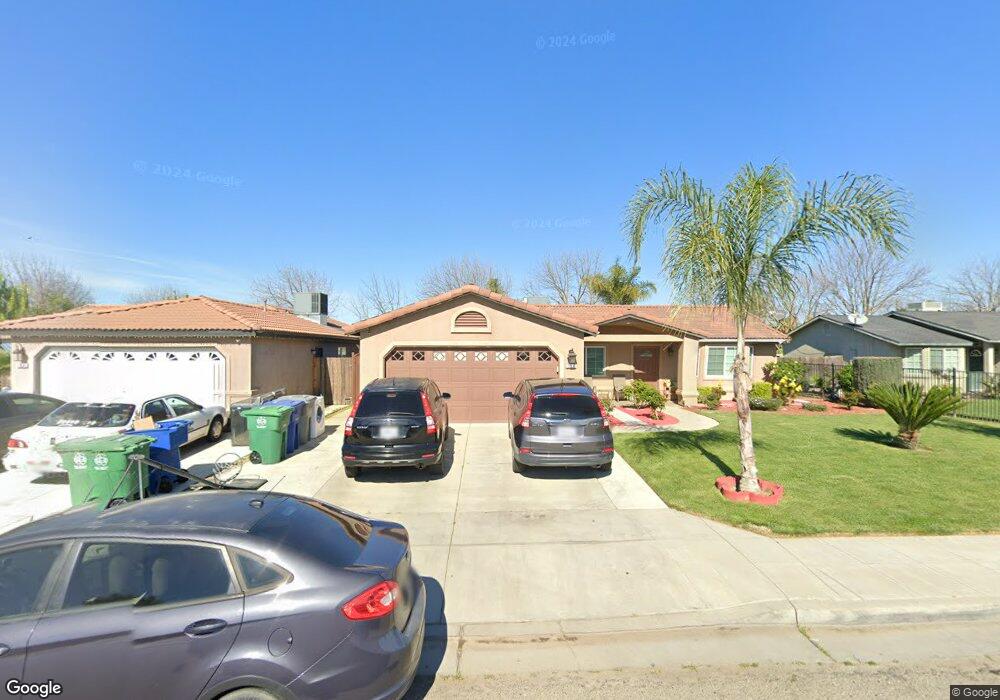
350 Molly Ave Chowchilla, CA 93610
Estimated Value: $354,931 - $399,000
3
Beds
2
Baths
1,420
Sq Ft
$267/Sq Ft
Est. Value
About This Home
This home is located at 350 Molly Ave, Chowchilla, CA 93610 and is currently estimated at $379,233, approximately $267 per square foot. 350 Molly Ave is a home with nearby schools including Merle L. Fuller Elementary School, Stephens Elementary School, and Ronald Reagan Elementary School.
Ownership History
Date
Name
Owned For
Owner Type
Purchase Details
Closed on
Sep 23, 2015
Sold by
Aredondo Martha Angelica
Bought by
Aredondo Zavala Martin
Current Estimated Value
Purchase Details
Closed on
Sep 3, 2014
Sold by
Oriole Homes Inc
Bought by
Zavala Martin Aredondo
Home Financials for this Owner
Home Financials are based on the most recent Mortgage that was taken out on this home.
Original Mortgage
$189,950
Interest Rate
3.78%
Mortgage Type
Future Advance Clause Open End Mortgage
Purchase Details
Closed on
Dec 11, 2012
Sold by
Chowchilla Investment Co Lp
Bought by
Ksa Investment Ltd
Purchase Details
Closed on
Sep 4, 2008
Sold by
Ans Development Inc
Bought by
Chowchilla Investment Co Lp
Purchase Details
Closed on
May 29, 2008
Sold by
Dmp Development Corp
Bought by
A N S Development Inc
Create a Home Valuation Report for This Property
The Home Valuation Report is an in-depth analysis detailing your home's value as well as a comparison with similar homes in the area
Home Values in the Area
Average Home Value in this Area
Purchase History
| Date | Buyer | Sale Price | Title Company |
|---|---|---|---|
| Aredondo Zavala Martin | -- | Fidelity National Title Co | |
| Zavala Martin Aredondo | $190,000 | Fidelity Natl Title Co Of Ca | |
| Ksa Investment Ltd | -- | Fidelity | |
| Chowchilla Investment Co Lp | -- | Fidelity Natl Title Co Of Ca | |
| A N S Development Inc | $294,000 | Chicago Title Company |
Source: Public Records
Mortgage History
| Date | Status | Borrower | Loan Amount |
|---|---|---|---|
| Previous Owner | Zavala Martin Aredondo | $189,950 |
Source: Public Records
Tax History Compared to Growth
Tax History
| Year | Tax Paid | Tax Assessment Tax Assessment Total Assessment is a certain percentage of the fair market value that is determined by local assessors to be the total taxable value of land and additions on the property. | Land | Improvement |
|---|---|---|---|---|
| 2025 | $2,464 | $224,915 | $35,511 | $189,404 |
| 2023 | $2,464 | $216,183 | $34,133 | $182,050 |
| 2022 | $2,310 | $211,945 | $33,464 | $178,481 |
| 2021 | $2,278 | $207,790 | $32,808 | $174,982 |
| 2020 | $2,222 | $205,660 | $32,472 | $173,188 |
| 2019 | $2,203 | $201,629 | $31,836 | $169,793 |
| 2018 | $2,155 | $197,676 | $31,212 | $166,464 |
| 2017 | $2,121 | $193,800 | $30,600 | $163,200 |
| 2016 | $2,080 | $22,841 | $22,841 | $0 |
| 2015 | $352 | $22,498 | $22,498 | $0 |
| 2014 | $347 | $22,058 | $22,058 | $0 |
Source: Public Records
Map
Nearby Homes
- 1604 Parkridge Dr
- 570 Parkridge Dr
- 105 Cedar Ct
- Roanoke Plan at Orchard View
- Dublin Plan at Orchard View
- Beaumont Plan at Orchard View
- Abernathy Plan at Orchard View
- Cumberland Plan at Orchard View
- Cabot Plan at Orchard View
- 584 Riley Ave
- 588 Riley Ave
- 585 Riley Ave
- 592 Riley Ave
- 593 Riley Ave
- 589 Riley Ave
- 581 Riley Ave
- 428 Oleander Dr
- 589 Victoria Ave
- 0 Avenue 25
- 881 Gill Way