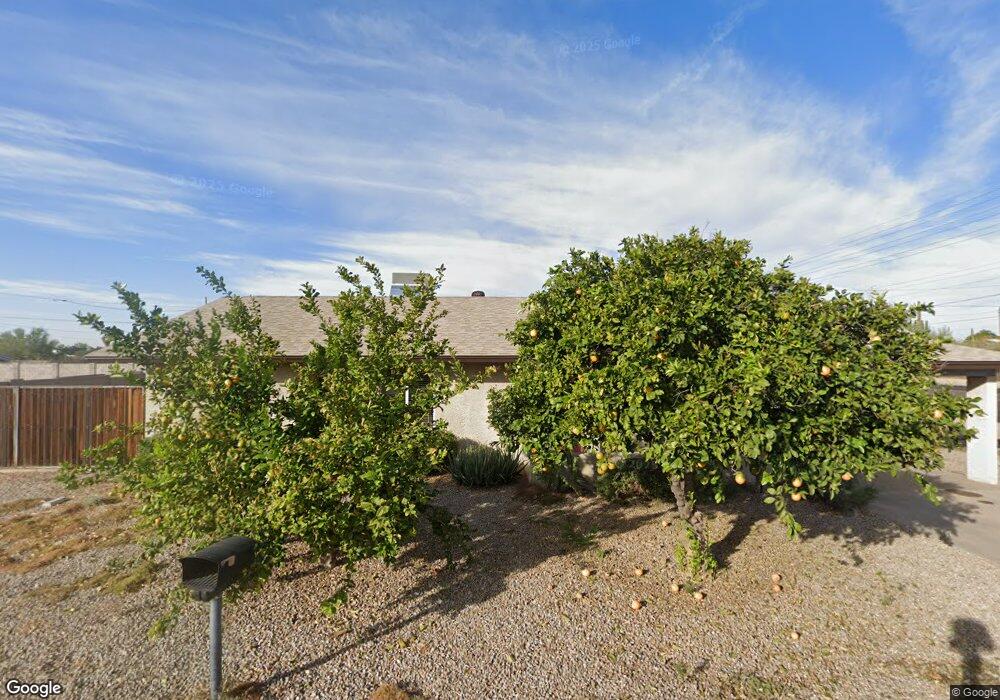
350 N James Ct Apache Junction, AZ 85120
University Manor NeighborhoodEstimated Value: $268,000 - $351,000
3
Beds
2
Baths
1,232
Sq Ft
$247/Sq Ft
Est. Value
About This Home
This home is located at 350 N James Ct, Apache Junction, AZ 85120 and is currently estimated at $304,087, approximately $246 per square foot. 350 N James Ct is a home located in Maricopa County with nearby schools including Sousa Elementary School, Franklin at Brimhall Elementary School, and Franklin West Elementary School.
Ownership History
Date
Name
Owned For
Owner Type
Purchase Details
Closed on
May 6, 2010
Sold by
Vik Douglas and Vik Myra E
Bought by
Varney Carmen I and Varney Gloria A
Current Estimated Value
Purchase Details
Closed on
Sep 11, 2009
Sold by
Barkmann Lee I and Barkmann Amber K
Bought by
Vik Douglas and Vik Myra E
Purchase Details
Closed on
Nov 28, 2006
Sold by
Barkmann Lee I and Ingram Bobby G
Bought by
Barkmann Lee I and Barkmann Amber K
Purchase Details
Closed on
Aug 16, 1999
Sold by
Valasquez Timothy W and Valasquez Timothy Wayne
Bought by
Barkmann Lee I and Ingram Bobby G
Home Financials for this Owner
Home Financials are based on the most recent Mortgage that was taken out on this home.
Original Mortgage
$80,368
Interest Rate
7.47%
Mortgage Type
FHA
Purchase Details
Closed on
May 14, 1998
Sold by
Humiston Jane and Velasquez Jane
Bought by
Velasquez Timothy Wayne
Home Financials for this Owner
Home Financials are based on the most recent Mortgage that was taken out on this home.
Original Mortgage
$57,000
Interest Rate
7.17%
Create a Home Valuation Report for This Property
The Home Valuation Report is an in-depth analysis detailing your home's value as well as a comparison with similar homes in the area
Home Values in the Area
Average Home Value in this Area
Purchase History
| Date | Buyer | Sale Price | Title Company |
|---|---|---|---|
| Varney Carmen I | $82,500 | Security Title Agency | |
| Vik Douglas | $40,400 | None Available | |
| Barkmann Lee I | -- | First American Title | |
| Barkmann Lee I | $80,500 | Ati Title Agency | |
| Velasquez Timothy Wayne | -- | Capital Title Agency |
Source: Public Records
Mortgage History
| Date | Status | Borrower | Loan Amount |
|---|---|---|---|
| Previous Owner | Barkmann Lee I | $80,368 | |
| Previous Owner | Velasquez Timothy Wayne | $57,000 |
Source: Public Records
Tax History
| Year | Tax Paid | Tax Assessment Tax Assessment Total Assessment is a certain percentage of the fair market value that is determined by local assessors to be the total taxable value of land and additions on the property. | Land | Improvement |
|---|---|---|---|---|
| 2025 | $760 | $8,432 | -- | -- |
| 2024 | $769 | $8,031 | -- | -- |
| 2023 | $769 | $22,860 | $4,570 | $18,290 |
| 2022 | $751 | $16,780 | $3,350 | $13,430 |
| 2021 | $749 | $14,570 | $2,910 | $11,660 |
| 2020 | $743 | $14,020 | $2,800 | $11,220 |
| 2019 | $688 | $11,830 | $2,360 | $9,470 |
| 2018 | $671 | $9,650 | $1,930 | $7,720 |
| 2017 | $648 | $8,650 | $1,730 | $6,920 |
| 2016 | $634 | $7,580 | $1,510 | $6,070 |
Source: Public Records
Map
Nearby Homes
- 10620 E Caballero St
- 345 N Signal Butte Rd Unit 23
- 10813 E Boston St
- 535 N Bailey Cir
- 460 N 104th St
- 10540 E Apache Trail Unit 15
- 10540 E Apache Trail Unit 6
- 10540 E Apache Trail Unit 91
- 10540 E Apache Trail Unit 93
- 10540 E Apache Trail Unit 127
- 10540 E Apache Trail Unit 182
- 538 N 110th St
- 10257 E Cicero Cir
- 10411 E 1st St
- 226 N 103rd Cir
- 146 N Merrill Rd Unit 163
- 146 N Merrill Rd Unit 64
- 146 N Merrill Rd Unit 71
- 146 N Merrill Rd Unit 165
- 146 N Merrill Rd Unit 21
- 344 N James Ct
- 349 N James Ct
- 343 N James Ct
- 338 N James Ct
- 337 N James Ct
- 10645 E University Dr Unit A-B
- 10647 E University Dr
- 000 E Mercury Dr Unit 5-A
- 10719 E University Dr
- 000000 E Mercury Dr Unit 5-A
- 10714 E Mercury Dr
- 10606 E Mercury Dr
- 10640 E Mercury Dr
- 10640 E Mercury Dr
- 10660 E Mercury Dr
- 10620 E Mercury Dr
- 10620 E Mercury Dr
- 10662 E University Dr
- 10620 E University Dr
- 10620 E University Dr
Your Personal Tour Guide
Ask me questions while you tour the home.