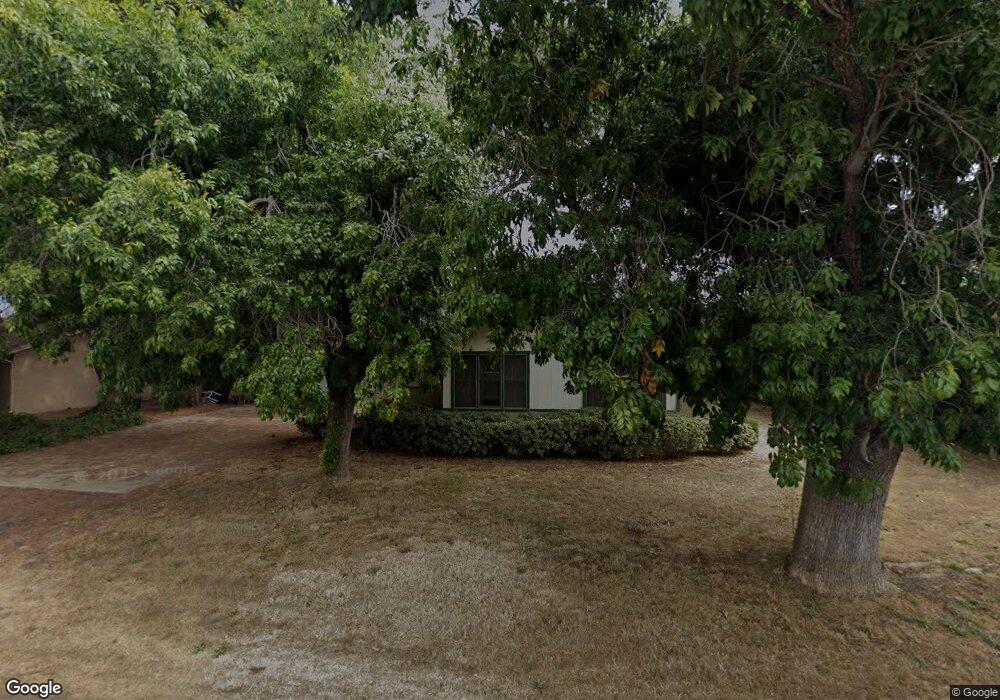
350 N Mallagh St Nipomo, CA 93444
Estimated Value: $622,000 - $765,000
3
Beds
2
Baths
1,581
Sq Ft
$434/Sq Ft
Est. Value
About This Home
This home is located at 350 N Mallagh St, Nipomo, CA 93444 and is currently estimated at $686,466, approximately $434 per square foot. 350 N Mallagh St is a home located in San Luis Obispo County with nearby schools including Nipomo Elementary School, Mesa Middle School, and Nipomo High School.
Ownership History
Date
Name
Owned For
Owner Type
Purchase Details
Closed on
Dec 8, 2012
Sold by
Berry Dennis Kaye
Bought by
Allied Farms Inc
Current Estimated Value
Purchase Details
Closed on
Feb 15, 2008
Sold by
Evans Virginia J
Bought by
Evans Virginia J and Berry Dennis Kaye
Home Financials for this Owner
Home Financials are based on the most recent Mortgage that was taken out on this home.
Original Mortgage
$465,000
Interest Rate
3%
Mortgage Type
Reverse Mortgage Home Equity Conversion Mortgage
Purchase Details
Closed on
Oct 18, 2003
Sold by
Evans Virginia J
Bought by
Evans Virginia J and Berry Dennis Kaye
Purchase Details
Closed on
Oct 23, 1996
Sold by
Evans Virginia J
Bought by
Evans Virginia J
Create a Home Valuation Report for This Property
The Home Valuation Report is an in-depth analysis detailing your home's value as well as a comparison with similar homes in the area
Home Values in the Area
Average Home Value in this Area
Purchase History
| Date | Buyer | Sale Price | Title Company |
|---|---|---|---|
| Allied Farms Inc | $181,000 | First American Title Company | |
| Evans Virginia J | -- | Accommodation | |
| Evans Virginia J | -- | First American Title Co | |
| Evans Virginia J | -- | First American Title Company | |
| Evans Virginia J | -- | -- |
Source: Public Records
Mortgage History
| Date | Status | Borrower | Loan Amount |
|---|---|---|---|
| Previous Owner | Evans Virginia J | $465,000 |
Source: Public Records
Tax History Compared to Growth
Tax History
| Year | Tax Paid | Tax Assessment Tax Assessment Total Assessment is a certain percentage of the fair market value that is determined by local assessors to be the total taxable value of land and additions on the property. | Land | Improvement |
|---|---|---|---|---|
| 2025 | $2,292 | $222,878 | $98,509 | $124,369 |
| 2024 | $2,266 | $218,509 | $96,578 | $121,931 |
| 2023 | $2,266 | $214,226 | $94,685 | $119,541 |
| 2022 | $2,232 | $210,027 | $92,829 | $117,198 |
| 2021 | $2,228 | $205,909 | $91,009 | $114,900 |
| 2020 | $2,203 | $203,798 | $90,076 | $113,722 |
| 2019 | $2,189 | $199,803 | $88,310 | $111,493 |
| 2018 | $2,163 | $195,886 | $86,579 | $109,307 |
| 2017 | $2,122 | $192,046 | $84,882 | $107,164 |
| 2016 | $2,002 | $188,281 | $83,218 | $105,063 |
| 2015 | $1,973 | $185,453 | $81,968 | $103,485 |
| 2014 | $1,900 | $181,821 | $80,363 | $101,458 |
Source: Public Records
Map
Nearby Homes
- 412 N Mallagh St
- 400 N Oakglen Ave
- 1 W Branch St
- 150 E Chestnut St
- 189 E Tefft St
- 0 S Burton St
- 160 San Antonio Ln
- 90111003 W Price St
- 449 W Tefft St Unit 23
- 449 W Tefft St Unit 13
- 285 E Tefft St
- 255 Encino Ln
- 228 Chaparral Ln
- 680 Hill St
- 525 Grande Ave Unit D
- 719 W Tefft St
- Mesa Plan at Hill Street Terraces - Hill Street Series
- Pacific Plan at Hill Street Terraces - Hill Street Series
- Monarch Plan at Hill Street Terraces - Hill Street Series
- Rancho Plan at Hill Street Terraces - Hill Street Series
- 360 N Mallagh St
- 330 Sea St
- 330 N Mallagh St
- 372 N Mallagh St
- 328 N Mallagh St
- 312 N Mallagh St
- 312 314 Mallagh St
- 314 N Mallagh St
- 380 N Mallagh St
- 325 N Burton St
- 321 N Burton St
- 308 N Mallagh St
- 311 N Burton St
- 396 N Mallagh St
- 304 N Mallagh St
- 303 N Burton St
- 171 Day St
- 146 Sea St
- 149 Sea St
- 295 N Burton St