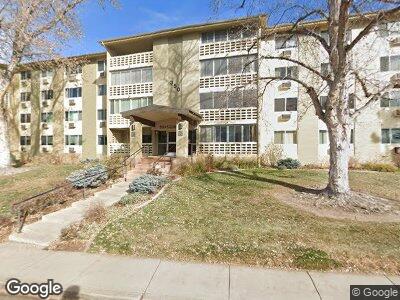
350 S Clinton St Unit 2368 Denver, CO 80247
Windsor NeighborhoodEstimated Value: $167,000 - $177,622
1
Bed
1
Bath
855
Sq Ft
$202/Sq Ft
Est. Value
About This Home
This home is located at 350 S Clinton St Unit 2368, Denver, CO 80247 and is currently estimated at $172,906, approximately $202 per square foot. 350 S Clinton St Unit 2368 is a home located in Denver County with nearby schools including Place Bridge Academy, George Washington High School, and Lotus School for Excellence.
Ownership History
Date
Name
Owned For
Owner Type
Purchase Details
Closed on
Jun 16, 2017
Sold by
Lafoon Richard
Bought by
Machamer Peggy
Current Estimated Value
Home Financials for this Owner
Home Financials are based on the most recent Mortgage that was taken out on this home.
Original Mortgage
$142,373
Outstanding Balance
$120,113
Interest Rate
4.02%
Mortgage Type
FHA
Estimated Equity
$56,426
Purchase Details
Closed on
Jun 7, 2002
Sold by
Hall Barbara Diane
Bought by
Lafoon Richard E
Home Financials for this Owner
Home Financials are based on the most recent Mortgage that was taken out on this home.
Original Mortgage
$39,000
Interest Rate
6.89%
Purchase Details
Closed on
Nov 10, 1997
Sold by
Bierman Dorothea J
Bought by
Bierman Dorothea J and Hall Barbara Diane
Home Financials for this Owner
Home Financials are based on the most recent Mortgage that was taken out on this home.
Original Mortgage
$51,200
Interest Rate
7.28%
Create a Home Valuation Report for This Property
The Home Valuation Report is an in-depth analysis detailing your home's value as well as a comparison with similar homes in the area
Home Values in the Area
Average Home Value in this Area
Purchase History
| Date | Buyer | Sale Price | Title Company |
|---|---|---|---|
| Machamer Peggy | $145,000 | First Integrity Title | |
| Lafoon Richard E | $83,000 | Land Title | |
| Bierman Dorothea J | -- | -- | |
| Bierman Dorothea J | $64,000 | -- |
Source: Public Records
Mortgage History
| Date | Status | Borrower | Loan Amount |
|---|---|---|---|
| Open | Machamer Peggy | $142,373 | |
| Previous Owner | Lafoon Richard E | $93,000 | |
| Previous Owner | Lafoon Richard E | $39,000 | |
| Previous Owner | Bierman Dorothea J | $51,200 |
Source: Public Records
Tax History Compared to Growth
Tax History
| Year | Tax Paid | Tax Assessment Tax Assessment Total Assessment is a certain percentage of the fair market value that is determined by local assessors to be the total taxable value of land and additions on the property. | Land | Improvement |
|---|---|---|---|---|
| 2024 | $636 | $8,030 | $190 | $7,840 |
| 2023 | $622 | $8,030 | $190 | $7,840 |
| 2022 | $806 | $10,130 | $190 | $9,940 |
| 2021 | $778 | $10,420 | $200 | $10,220 |
| 2020 | $821 | $11,070 | $1,320 | $9,750 |
| 2019 | $798 | $11,070 | $1,320 | $9,750 |
| 2018 | $720 | $9,310 | $200 | $9,110 |
| 2017 | $718 | $9,310 | $200 | $9,110 |
| 2016 | $517 | $6,340 | $820 | $5,520 |
| 2015 | $495 | $6,340 | $820 | $5,520 |
| 2014 | $364 | $4,380 | $1,027 | $3,353 |
Source: Public Records
Map
Nearby Homes
- 300 S Clinton St Unit 7D
- 350 S Clinton St Unit 9C
- 350 S Clinton St Unit 7A
- 350 S Clinton St Unit 8C
- 580 S Clinton St Unit 12C
- 495 S Dayton St Unit 1C
- 495 S Dayton St Unit 1D
- 495 S Dayton St Unit 6D
- 9655 E Center Ave Unit 9D
- 495 S Dayton St Unit 10C
- 9625 E Center Ave Unit 4C
- 9315 E Center Ave Unit 11A
- 9300 E Center Ave Unit 3A
- 9300 E Center Ave Unit 2B
- 9335 E Center Ave Unit 7C
- 9335 E Center Ave Unit 1B
- 9385 E Center Ave Unit 1B
- 9385 E Center Ave Unit 6A
- 710 S Alton Way Unit 5A
- 9335 E Center Ave Unit 7B
- 350 S Clinton St Unit 12D
- 350 S Clinton St Unit 2384
- 350 S Clinton St
- 350 S Clinton St Unit 2382
- 350 S Clinton St
- 350 S Clinton St
- 350 S Clinton St
- 350 S Clinton St Unit 2378
- 350 S Clinton St Unit 2377
- 350 S Clinton St
- 350 S Clinton St Unit 3D
- 350 S Clinton St Unit 2374
- 350 S Clinton St
- 350 S Clinton St
- 350 S Clinton St Unit 11C
- 350 S Clinton St
- 350 S Clinton St Unit 2368
- 350 S Clinton St
- 350 S Clinton St
- 350 S Clinton St