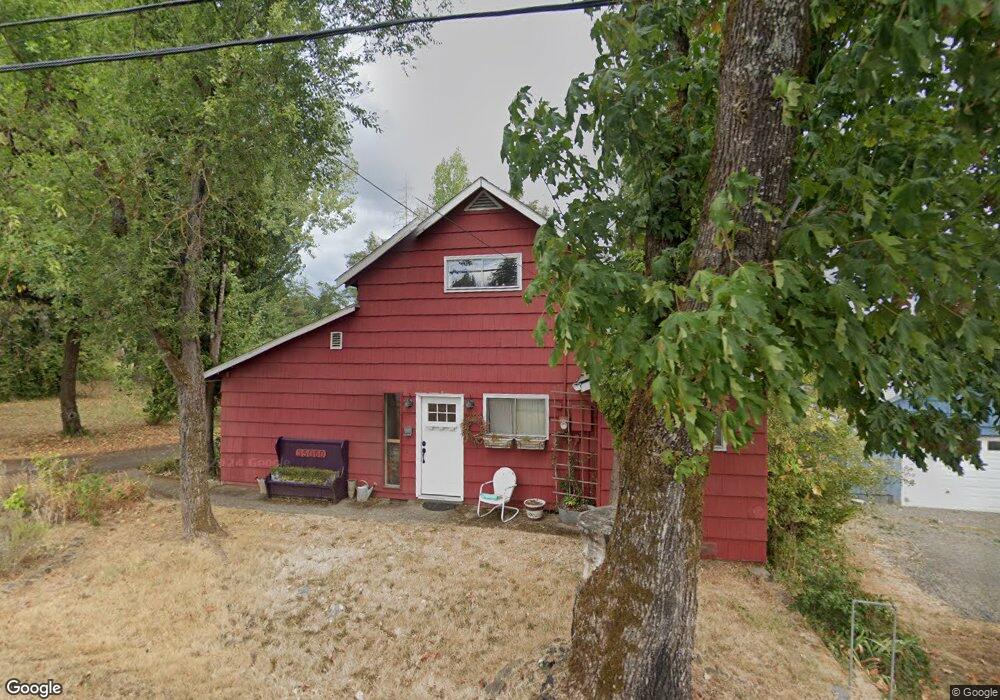
350 SW James St Willamina, OR 97396
Estimated Value: $326,000 - $410,000
5
Beds
2
Baths
1,865
Sq Ft
$197/Sq Ft
Est. Value
About This Home
This home is located at 350 SW James St, Willamina, OR 97396 and is currently estimated at $367,778, approximately $197 per square foot. 350 SW James St is a home located in Polk County with nearby schools including Willamina Elementary School, Willamina Middle School, and Willamina High School.
Ownership History
Date
Name
Owned For
Owner Type
Purchase Details
Closed on
Aug 6, 2010
Sold by
Us Bank National Association
Bought by
Stahl Christy R
Current Estimated Value
Home Financials for this Owner
Home Financials are based on the most recent Mortgage that was taken out on this home.
Original Mortgage
$117,098
Outstanding Balance
$77,295
Interest Rate
4.51%
Mortgage Type
New Conventional
Estimated Equity
$290,483
Purchase Details
Closed on
Dec 28, 2009
Sold by
Dodge Dean and Dodge Majie
Bought by
U S Bank National Association
Purchase Details
Closed on
Jul 14, 2006
Sold by
Tosi Marcy and Landis Nancy R
Bought by
Dodge Dean and Dodge Majie
Home Financials for this Owner
Home Financials are based on the most recent Mortgage that was taken out on this home.
Original Mortgage
$119,900
Interest Rate
7.85%
Mortgage Type
Stand Alone First
Create a Home Valuation Report for This Property
The Home Valuation Report is an in-depth analysis detailing your home's value as well as a comparison with similar homes in the area
Home Values in the Area
Average Home Value in this Area
Purchase History
| Date | Buyer | Sale Price | Title Company |
|---|---|---|---|
| Stahl Christy R | $113,000 | Fidelity National Title | |
| U S Bank National Association | $92,655 | Accommodation | |
| Dodge Dean | $149,900 | Ticor Title Insurance Co |
Source: Public Records
Mortgage History
| Date | Status | Borrower | Loan Amount |
|---|---|---|---|
| Open | Stahl Christy R | $117,098 | |
| Previous Owner | Dodge Dean | $119,900 |
Source: Public Records
Tax History Compared to Growth
Tax History
| Year | Tax Paid | Tax Assessment Tax Assessment Total Assessment is a certain percentage of the fair market value that is determined by local assessors to be the total taxable value of land and additions on the property. | Land | Improvement |
|---|---|---|---|---|
| 2025 | $2,146 | $139,160 | $24,040 | $115,120 |
| 2024 | $2,146 | $135,110 | $23,340 | $111,770 |
| 2023 | $2,004 | $131,180 | $22,660 | $108,520 |
| 2022 | $1,937 | $127,360 | $22,000 | $105,360 |
| 2021 | $1,886 | $123,660 | $21,360 | $102,300 |
| 2020 | $1,826 | $120,060 | $20,740 | $99,320 |
| 2019 | $1,654 | $116,570 | $20,130 | $96,440 |
| 2018 | $1,632 | $113,180 | $19,550 | $93,630 |
| 2017 | $1,602 | $109,890 | $18,980 | $90,910 |
| 2016 | $1,622 | $106,690 | $18,420 | $88,270 |
| 2015 | $1,589 | $103,590 | $17,890 | $85,700 |
| 2014 | $1,518 | $100,580 | $17,370 | $83,210 |
Source: Public Records
Map
Nearby Homes
- 321 SW James St
- 140 SE Lamson St
- 780 SW Hill Dr
- 368 NE Yamhill St
- 541 NW Churchman
- 175 NW 3rd St
- 350 NW Willamina Dr
- 327 NW Pacific Hills Dr
- 315 NW Pacific Hills Dr
- 453 NE Yamhill St
- 323 NW Pacific Hills Dr
- 321 NW Pacific Hills Dr
- 320 NW Pacific Hills Dr
- 750 SW Pioneer Ct
- 413 NW Pacific Hills Dr
- 790 SW Pioneer Ct
- 182 NE 5th St
- 651 NE Main St
- 1532 SW Pioneer Dr
- 764 NE Main St
- 312 SW James St
- 341 SW James St
- 0 SW James St Unit 722352
- 0 SW James St Unit 2400 17384692
- 0 SW James St Unit 2201 17232526
- 371 SW James St
- 568 SW Cedar Ln
- 687 Vine St
- 271 SW James St
- 262 SW James St
- 651 SW Cherry St
- 548 SW Cedar Ln
- 551 SW Branson St
- 660 SW Cherry St
- 521 SW Branson St
- 431 NW Main St
- 461 SW Main St
- 461 S Main St
- 251 SW James St
- 445 SW Barber Ave