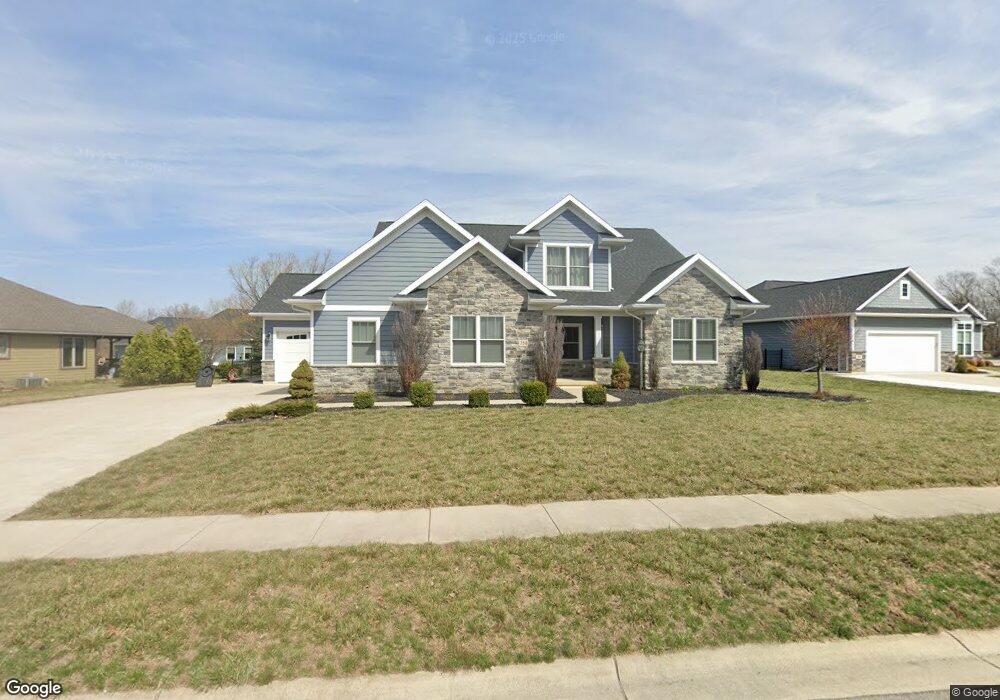
350 Sycamore Ct Bluffton, OH 45817
Estimated Value: $377,000 - $511,000
4
Beds
3
Baths
2,488
Sq Ft
$178/Sq Ft
Est. Value
About This Home
This home is located at 350 Sycamore Ct, Bluffton, OH 45817 and is currently estimated at $442,047, approximately $177 per square foot. 350 Sycamore Ct is a home with nearby schools including Bluffton Elementary School, Bluffton Middle School, and Bluffton High School.
Ownership History
Date
Name
Owned For
Owner Type
Purchase Details
Closed on
Jul 17, 2019
Sold by
Johnstone David Weston
Bought by
Johnstone Jennifer Lynn
Current Estimated Value
Home Financials for this Owner
Home Financials are based on the most recent Mortgage that was taken out on this home.
Original Mortgage
$267,500
Outstanding Balance
$234,354
Interest Rate
3.82%
Mortgage Type
New Conventional
Estimated Equity
$207,693
Purchase Details
Closed on
Aug 11, 2016
Sold by
Pandora Contracting Llc
Bought by
Johnstone David Weston and Johnstone Jennifer Lynn
Home Financials for this Owner
Home Financials are based on the most recent Mortgage that was taken out on this home.
Original Mortgage
$272,500
Interest Rate
3.48%
Mortgage Type
Future Advance Clause Open End Mortgage
Purchase Details
Closed on
Nov 30, 2015
Sold by
Clemens Stanley and Clemens Joenita
Bought by
Pandora Contracting Llc
Create a Home Valuation Report for This Property
The Home Valuation Report is an in-depth analysis detailing your home's value as well as a comparison with similar homes in the area
Home Values in the Area
Average Home Value in this Area
Purchase History
| Date | Buyer | Sale Price | Title Company |
|---|---|---|---|
| Johnstone Jennifer Lynn | -- | None Available | |
| Johnstone David Weston | $40,000 | None Available | |
| Pandora Contracting Llc | $33,800 | None Available |
Source: Public Records
Mortgage History
| Date | Status | Borrower | Loan Amount |
|---|---|---|---|
| Open | Johnstone Jennifer Lynn | $267,500 | |
| Closed | Johnstone David Weston | $272,500 |
Source: Public Records
Tax History Compared to Growth
Tax History
| Year | Tax Paid | Tax Assessment Tax Assessment Total Assessment is a certain percentage of the fair market value that is determined by local assessors to be the total taxable value of land and additions on the property. | Land | Improvement |
|---|---|---|---|---|
| 2024 | $4,141 | $125,410 | $11,100 | $114,310 |
| 2023 | $4,250 | $119,420 | $10,570 | $108,850 |
| 2022 | $4,298 | $119,420 | $10,570 | $108,850 |
| 2021 | $4,326 | $119,420 | $10,570 | $108,850 |
| 2020 | $3,963 | $98,880 | $10,010 | $88,870 |
| 2019 | $3,963 | $98,880 | $10,010 | $88,870 |
| 2018 | $2,960 | $98,880 | $10,010 | $88,870 |
| 2017 | $1,942 | $47,040 | $10,010 | $37,030 |
| 2016 | $348 | $8,020 | $8,020 | $0 |
| 2015 | $338 | $8,020 | $8,020 | $0 |
| 2014 | $370 | $8,470 | $8,470 | $0 |
| 2013 | $337 | $8,470 | $8,470 | $0 |
Source: Public Records
Map
Nearby Homes
- 349 Sycamore Ct
- 110 Magnolia Ln
- 182 Sunset Dr
- 10755 Bixel Rd
- 0 Columbus Grove-Bluffton Rd
- 222 Grove St
- 212 S Lawn Ave
- 217 Grove St
- 430 S Jackson St
- 222 N Lawn Ave
- 513 S Jackson St
- 307 Parkview Dr
- 305 Parkview Dr
- 313 Parkview Dr
- 303 Parkview Dr
- 315 Parkview Dr
- 301 Parkview Dr
- 317 Parkview Dr
- 319 Parkview Dr
- 210 N Jackson St
- 351 Sycamore Ct
- 46 Sycamore Ct
- 50 Sycamore Ct
- 45 Sycamore Ct
- 472 Riverbend Dr
- 352 Sycamore Ct
- 460 Riverbend Dr
- 343 Sycamore Ct
- 348 Sycamore Ct
- 462 Riverbend Dr
- 342 Sycamore Ct
- 461 Riverbend Dr
- 347 Sycamore Ct
- 345 Sycamore Ct
- 341 Sycamore Ct
- 346 Sycamore Ct
- 463 Riverbend Dr
- 468 Riverbend Dr
- 471 Riverbend Dr