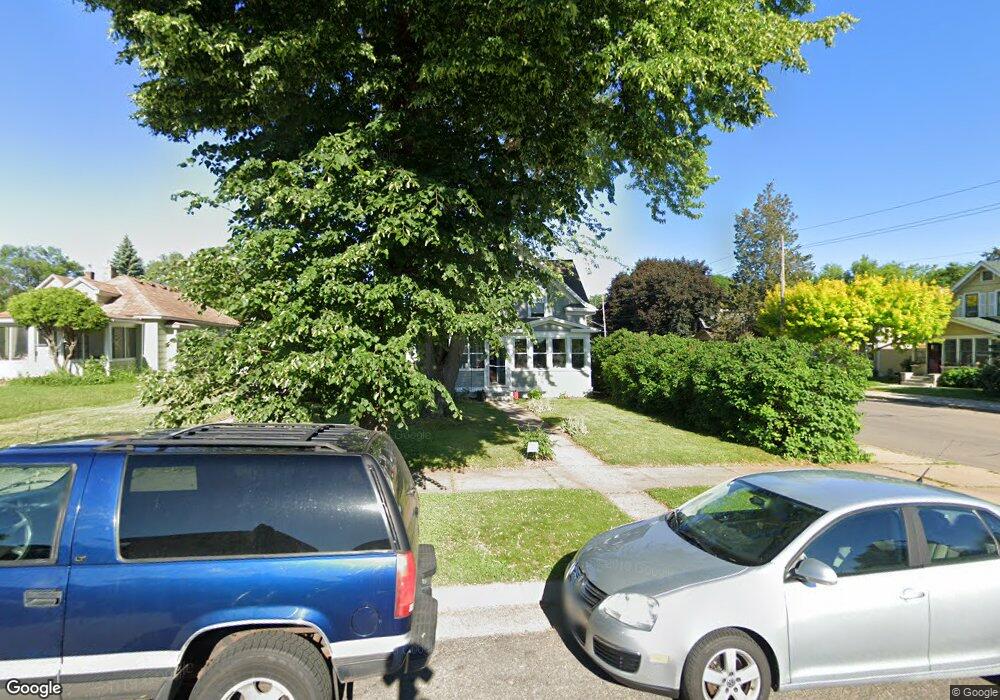
3500 22nd Ave S Minneapolis, MN 55407
Corcoran NeighborhoodEstimated Value: $319,212 - $383,000
2
Beds
2
Baths
1,164
Sq Ft
$296/Sq Ft
Est. Value
About This Home
This home is located at 3500 22nd Ave S, Minneapolis, MN 55407 and is currently estimated at $344,553, approximately $296 per square foot. 3500 22nd Ave S is a home located in Hennepin County with nearby schools including Andersen Middle, South Senior High School, and Universal Academy Charter School.
Ownership History
Date
Name
Owned For
Owner Type
Purchase Details
Closed on
Mar 20, 2020
Sold by
Klassen Glanzer Ivy and Torossi Michael
Bought by
Churchward Travis and Novak Bridget
Current Estimated Value
Home Financials for this Owner
Home Financials are based on the most recent Mortgage that was taken out on this home.
Original Mortgage
$224,400
Outstanding Balance
$198,359
Interest Rate
3.4%
Mortgage Type
New Conventional
Estimated Equity
$146,194
Purchase Details
Closed on
Sep 12, 2019
Sold by
Glanzer Lades
Bought by
Klassen Glanzer Ivy
Purchase Details
Closed on
Dec 11, 2015
Sold by
Covell Matthew
Bought by
Torossi Michael and Klassen Glanzer Ivy
Purchase Details
Closed on
Jun 15, 2012
Sold by
Carroll Mary A
Bought by
Covell Matthew
Home Financials for this Owner
Home Financials are based on the most recent Mortgage that was taken out on this home.
Original Mortgage
$141,882
Interest Rate
3.87%
Mortgage Type
FHA
Purchase Details
Closed on
Aug 28, 1998
Sold by
Bengtson Dwight D
Bought by
Carroll Mary A
Create a Home Valuation Report for This Property
The Home Valuation Report is an in-depth analysis detailing your home's value as well as a comparison with similar homes in the area
Home Values in the Area
Average Home Value in this Area
Purchase History
| Date | Buyer | Sale Price | Title Company |
|---|---|---|---|
| Churchward Travis | $264,000 | Legacy Title | |
| Klassen Glanzer Ivy | -- | None Available | |
| Torossi Michael | $187,000 | Network Title Inc | |
| Covell Matthew | $144,500 | Burnet Title | |
| Carroll Mary A | $87,900 | -- |
Source: Public Records
Mortgage History
| Date | Status | Borrower | Loan Amount |
|---|---|---|---|
| Open | Churchward Travis | $224,400 | |
| Previous Owner | Covell Matthew | $141,882 |
Source: Public Records
Tax History
| Year | Tax Paid | Tax Assessment Tax Assessment Total Assessment is a certain percentage of the fair market value that is determined by local assessors to be the total taxable value of land and additions on the property. | Land | Improvement |
|---|---|---|---|---|
| 2024 | $3,896 | $282,000 | $97,000 | $185,000 |
| 2023 | $3,756 | $288,000 | $90,000 | $198,000 |
| 2022 | $3,130 | $271,000 | $79,000 | $192,000 |
| 2021 | $2,646 | $240,000 | $46,000 | $194,000 |
| 2020 | $2,867 | $213,500 | $35,700 | $177,800 |
| 2019 | $2,796 | $213,500 | $23,800 | $189,700 |
| 2018 | $2,531 | $203,500 | $23,800 | $179,700 |
| 2017 | $2,464 | $178,500 | $21,600 | $156,900 |
| 2016 | $2,331 | $166,000 | $21,600 | $144,400 |
| 2015 | $2,281 | $144,500 | $21,600 | $122,900 |
| 2014 | -- | $144,500 | $21,600 | $122,900 |
Source: Public Records
Map
Nearby Homes
- 3520 21st Ave S
- 3512 21st Ave S
- 1911 E 35th St
- 3325 22nd Ave S
- 3501 Longfellow Ave
- 3735 21st Ave S
- 3509 Cedar Ave S
- 3437 Cedar Ave S
- 3444 Cedar Ave S
- 3520 27th Ave S
- 2530 E 34th St Unit 112
- 3208 24th Ave S
- 2309 E 32nd St
- 3429 17th Ave S
- 3208 19th Ave S
- 3206 19th Ave S
- 3852 22nd Ave S
- 3847 Cedar Ave S
- 3429 Bloomington Ave
- 3637 Bloomington Ave
- 3504 22nd Ave S
- 3506 22nd Ave S
- 3510 22nd Ave S
- 3500 3500 22nd-Avenue-s
- 2115 E 35th St
- 2128 E 35th St
- 2124 E 35th St
- 2130 E 35th St
- 2120 E 35th St
- 2132 E 35th St
- 2118 E 35th St
- 3514 22nd Ave S
- 2114 E 35th St
- 2110 E 35th St
- 3511 21st Ave S
- 3518 22nd Ave S
- 3505 22nd Ave S
- 2200 E 35th St
- 3513 21st Ave S
- 3440 22nd Ave S
Your Personal Tour Guide
Ask me questions while you tour the home.