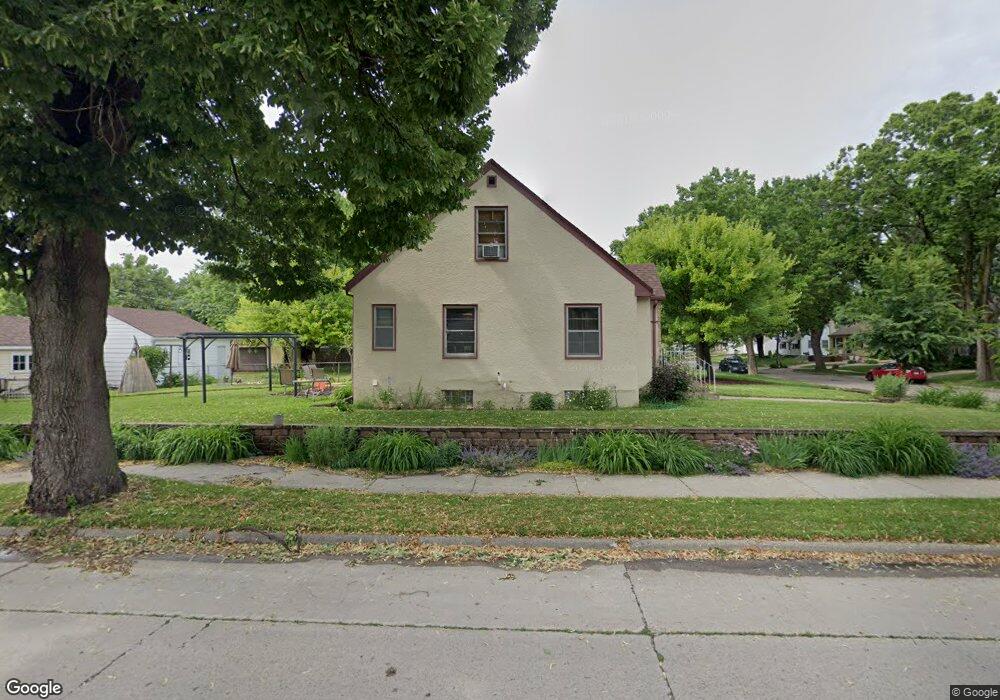
3500 Fillmore St NE Minneapolis, MN 55418
Waite Park NeighborhoodEstimated Value: $286,225 - $302,000
2
Beds
1
Bath
1,004
Sq Ft
$292/Sq Ft
Est. Value
About This Home
This home is located at 3500 Fillmore St NE, Minneapolis, MN 55418 and is currently estimated at $293,556, approximately $292 per square foot. 3500 Fillmore St NE is a home located in Hennepin County with nearby schools including Waite Park Elementary School, Northeast Middle School, and Thomas Edison High School.
Ownership History
Date
Name
Owned For
Owner Type
Purchase Details
Closed on
Jul 31, 2018
Sold by
Davis Andrew W and Sajady Nasreen
Bought by
Nelson Jillian
Current Estimated Value
Home Financials for this Owner
Home Financials are based on the most recent Mortgage that was taken out on this home.
Original Mortgage
$178,600
Interest Rate
4.8%
Mortgage Type
New Conventional
Purchase Details
Closed on
Jan 31, 2018
Sold by
Davis Andrew W and Davis Nasreen
Bought by
Nelson Jillian
Home Financials for this Owner
Home Financials are based on the most recent Mortgage that was taken out on this home.
Original Mortgage
$178,600
Interest Rate
4.8%
Mortgage Type
New Conventional
Purchase Details
Closed on
Sep 30, 2015
Sold by
Davis Andrew and Sajady Nasreen
Bought by
Nelson Jillian
Home Financials for this Owner
Home Financials are based on the most recent Mortgage that was taken out on this home.
Original Mortgage
$171,000
Interest Rate
6.39%
Mortgage Type
Seller Take Back
Purchase Details
Closed on
Mar 20, 2000
Sold by
Ross Evelyn
Bought by
Ross Richard M
Create a Home Valuation Report for This Property
The Home Valuation Report is an in-depth analysis detailing your home's value as well as a comparison with similar homes in the area
Home Values in the Area
Average Home Value in this Area
Purchase History
| Date | Buyer | Sale Price | Title Company |
|---|---|---|---|
| Nelson Jillian | $175,000 | None Available | |
| Nelson Jillian | $175,000 | Indecomm Global Services | |
| Nelson Jillian | $175,000 | None Available | |
| Ross Richard M | $65,000 | -- |
Source: Public Records
Mortgage History
| Date | Status | Borrower | Loan Amount |
|---|---|---|---|
| Previous Owner | Nelson Jillian | $178,600 | |
| Previous Owner | Nelson Jillian | $178,600 | |
| Previous Owner | Nelson Jillian | $171,000 |
Source: Public Records
Tax History Compared to Growth
Tax History
| Year | Tax Paid | Tax Assessment Tax Assessment Total Assessment is a certain percentage of the fair market value that is determined by local assessors to be the total taxable value of land and additions on the property. | Land | Improvement |
|---|---|---|---|---|
| 2024 | $3,532 | $256,000 | $104,000 | $152,000 |
| 2023 | $3,456 | $273,000 | $93,000 | $180,000 |
| 2022 | $3,312 | $271,000 | $86,000 | $185,000 |
| 2021 | $2,755 | $249,000 | $60,000 | $189,000 |
| 2020 | $2,936 | $218,000 | $55,500 | $162,500 |
| 2019 | $3,016 | $218,000 | $37,000 | $181,000 |
| 2018 | $2,945 | $202,000 | $37,000 | $165,000 |
| 2017 | $2,656 | $172,500 | $33,600 | $138,900 |
| 2016 | $2,170 | $156,500 | $33,600 | $122,900 |
| 2015 | $2,128 | $148,000 | $33,600 | $114,400 |
| 2014 | -- | $137,500 | $33,600 | $103,900 |
Source: Public Records
Map
Nearby Homes
- 3438 Taylor St NE
- 3543 Fillmore St NE
- 3567 Pierce St NE
- 3243 Pierce St NE
- 3227 Tyler St NE
- 3639 Lincoln St NE
- 3423 Ulysses St NE
- 3154 Lincoln St NE
- 3627 Quincy St NE
- 731 36th Ave NE
- 3050 Pierce St NE
- 3049 Tyler St NE
- 3806 Jackson St NE
- 3927 Reservoir Blvd
- 3942 Tyler St NE
- 2943 Taylor St NE
- 1025 Gould Ave NE
- 3979 Reservoir Blvd
- 590 36th Ave NE
- 3932 Ulysses St NE
- 3506 Fillmore St NE
- 3510 Fillmore St NE
- 3458 Fillmore St NE
- 3514 Fillmore St NE
- 3501 Taylor St NE
- 3454 Fillmore St NE
- 3507 Taylor St NE
- 3511 Taylor St NE
- 3459 Taylor St NE
- 3501 Fillmore St NE
- 3455 Taylor St NE
- 3522 Fillmore St NE
- 3507 Fillmore St NE
- 3515 Taylor St NE
- 3446 Fillmore St NE
- 3511 Fillmore St NE
- 3451 Taylor St NE
- 3526 Fillmore St NE
- 3519 Taylor St NE
- 3515 Fillmore St NE