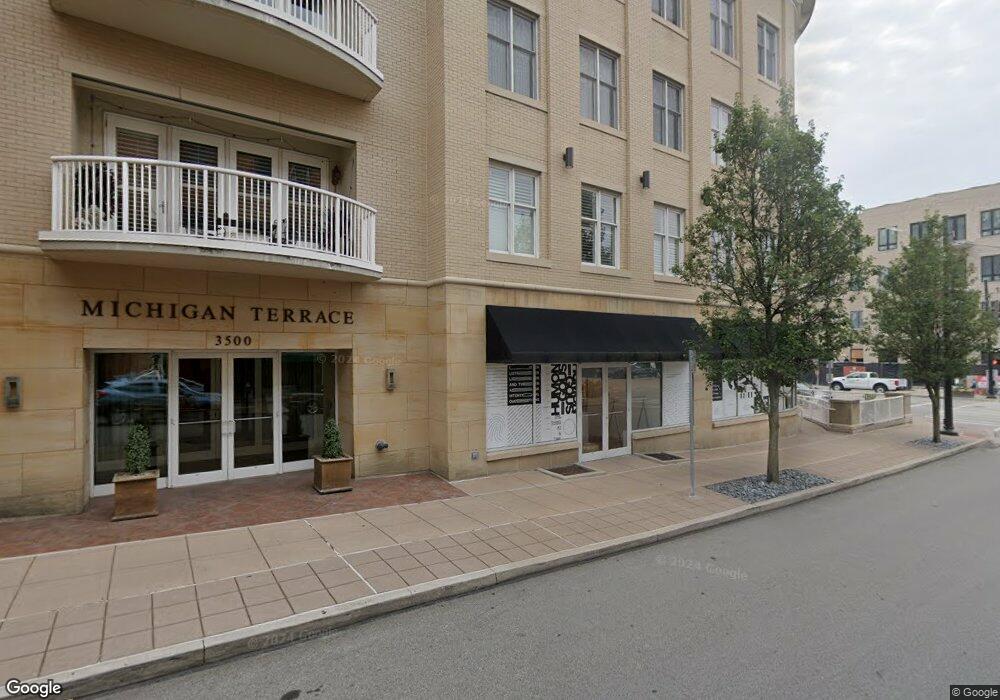
3500 Michigan Ave Unit 52 Cincinnati, OH 45208
Hyde Park NeighborhoodEstimated Value: $1,672,000 - $1,895,000
3
Beds
4
Baths
3,272
Sq Ft
$547/Sq Ft
Est. Value
About This Home
This home is located at 3500 Michigan Ave Unit 52, Cincinnati, OH 45208 and is currently estimated at $1,788,368, approximately $546 per square foot. 3500 Michigan Ave Unit 52 is a home located in Hamilton County with nearby schools including Clark Montessori High School, Withrow University High School, and Shroder High School.
Ownership History
Date
Name
Owned For
Owner Type
Purchase Details
Closed on
Oct 23, 2023
Sold by
Kurz That S George & Jo Ann T
Bought by
Etr 3500 Michigan Llc
Current Estimated Value
Purchase Details
Closed on
Oct 19, 2023
Sold by
Jo Kurz S and Jo Ann
Bought by
Kurz S George S and Kurz Jo Ann
Purchase Details
Closed on
Nov 30, 2010
Sold by
Thompson David L and Thompson Blake Lindner
Bought by
Kurz S George and Kurz Jo Ann T
Purchase Details
Closed on
Feb 9, 2007
Sold by
Michigan Terrace Llc
Bought by
Thompson David L and Thompson Blake Lindner
Home Financials for this Owner
Home Financials are based on the most recent Mortgage that was taken out on this home.
Original Mortgage
$643,890
Interest Rate
6.23%
Mortgage Type
Purchase Money Mortgage
Create a Home Valuation Report for This Property
The Home Valuation Report is an in-depth analysis detailing your home's value as well as a comparison with similar homes in the area
Home Values in the Area
Average Home Value in this Area
Purchase History
| Date | Buyer | Sale Price | Title Company |
|---|---|---|---|
| Etr 3500 Michigan Llc | $500 | None Listed On Document | |
| Kurz S George S | $500 | None Listed On Document | |
| Kurz S George | $975,000 | Attorney | |
| Thompson David L | $1,331,800 | Attorney |
Source: Public Records
Mortgage History
| Date | Status | Borrower | Loan Amount |
|---|---|---|---|
| Previous Owner | Thompson David L | $643,890 |
Source: Public Records
Tax History Compared to Growth
Tax History
| Year | Tax Paid | Tax Assessment Tax Assessment Total Assessment is a certain percentage of the fair market value that is determined by local assessors to be the total taxable value of land and additions on the property. | Land | Improvement |
|---|---|---|---|---|
| 2024 | $27,876 | $467,915 | $63,700 | $404,215 |
| 2023 | $28,510 | $467,915 | $63,700 | $404,215 |
| 2022 | $25,767 | $379,351 | $49,000 | $330,351 |
| 2021 | $19,184 | $379,351 | $49,000 | $330,351 |
| 2020 | $19,748 | $379,351 | $49,000 | $330,351 |
| 2019 | $21,637 | $379,351 | $49,000 | $330,351 |
| 2018 | $21,669 | $379,351 | $49,000 | $330,351 |
| 2017 | $20,585 | $379,351 | $49,000 | $330,351 |
| 2016 | $17,758 | $302,869 | $48,020 | $254,849 |
| 2015 | $16,011 | $302,869 | $48,020 | $254,849 |
| 2014 | $16,126 | $302,869 | $48,020 | $254,849 |
| 2013 | $16,739 | $309,050 | $49,000 | $260,050 |
Source: Public Records
Map
Nearby Homes
- 2800 Erie Ave
- 3506 Shaw Ave
- 3504 Shaw Ave
- 2821 Astoria Ave
- 2770 Observatory Ave Unit 102
- 2805 Observatory Ave
- 2851 Pine Grove Ave
- 3556 Mooney Ave
- 3641 Michigan Ave
- 2847 Minto Ave
- 3430 Burch Ave
- 2837 Linwood Ave
- 3716 Woodland Ave
- 3632 Columbus Ave
- 3649 Besuden Ct
- 3733 Andrew Ave
- 3633 Stettinius Ave
- 3742 Woodland Ave
- 2868 Pineridge Ave
- 3653 Paxton Ave
- 3500 Michigan Ave Unit 3
- 3500 Michigan Ave Unit 2
- 3500 Michigan Ave Unit 41
- 3500 Michigan Ave Unit 31
- 3500 Michigan Ave Unit 43
- 3500 Michigan Ave Unit 24
- 3500 Michigan Ave Unit 21
- 3500 Michigan Ave
- 3500 Michigan Ave Unit 51
- 3500 Michigan Ave Unit 22
- 3500 Michigan Ave Unit 32
- 3500 Michigan Ave Unit 23
- 3500 Michigan Ave
- 3500 Michigan Ave
- 3500 Michigan Ave Unit 33
- 3500 Michigan Ave
- 3500 Michigan Ave Unit 44
- 3500 Michigan Ave Unit 34
- 3500 Michigan Ave Unit 61
- 3503 Michigan Ave