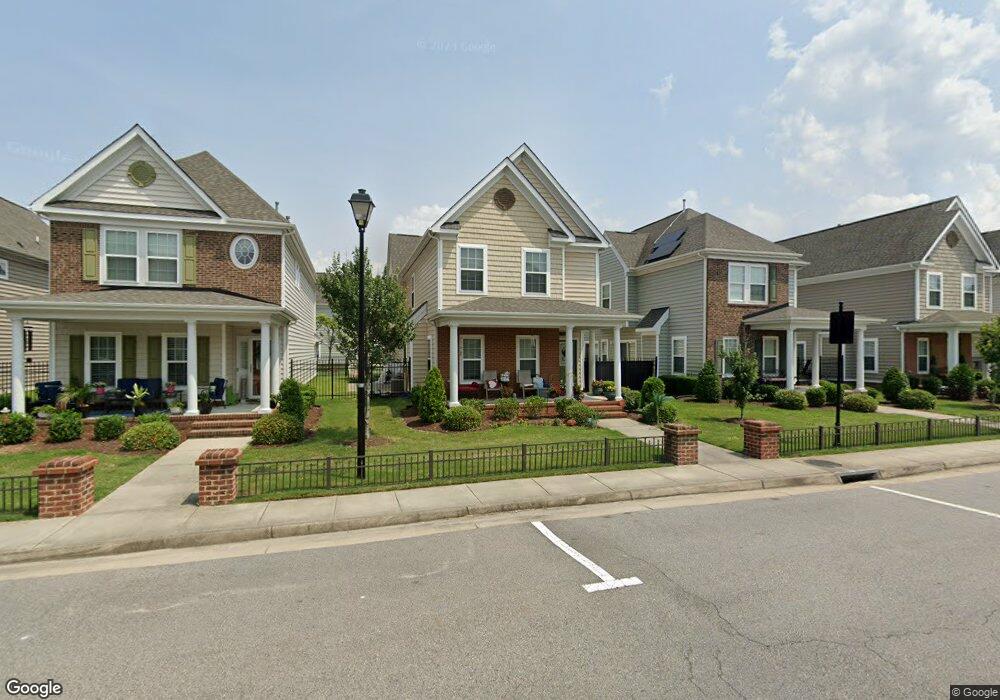
3500 Prices Fork Blvd Suffolk, VA 23435
Nansemond NeighborhoodEstimated Value: $344,000 - $357,000
4
Beds
3
Baths
1,792
Sq Ft
$196/Sq Ft
Est. Value
About This Home
This home is located at 3500 Prices Fork Blvd, Suffolk, VA 23435 and is currently estimated at $351,549, approximately $196 per square foot. 3500 Prices Fork Blvd is a home located in Suffolk City with nearby schools including Creekside Elementary School, John Yeates Middle School, and Nansemond River High School.
Ownership History
Date
Name
Owned For
Owner Type
Purchase Details
Closed on
Nov 19, 2021
Sold by
Arnold Selby
Bought by
Malik Sidra
Current Estimated Value
Home Financials for this Owner
Home Financials are based on the most recent Mortgage that was taken out on this home.
Original Mortgage
$296,038
Outstanding Balance
$260,733
Interest Rate
2.88%
Mortgage Type
New Conventional
Estimated Equity
$86,116
Purchase Details
Closed on
Jun 25, 2020
Sold by
Maldonado Juanita
Bought by
Arnold Selby
Home Financials for this Owner
Home Financials are based on the most recent Mortgage that was taken out on this home.
Original Mortgage
$219,936
Interest Rate
3.2%
Mortgage Type
VA
Purchase Details
Closed on
Jan 14, 2016
Sold by
Terry/Peterson Residential Thirty Llc A
Bought by
Maldonado Guadalupe and Maldonado Juanita
Home Financials for this Owner
Home Financials are based on the most recent Mortgage that was taken out on this home.
Original Mortgage
$247,326
Interest Rate
3.98%
Mortgage Type
VA
Create a Home Valuation Report for This Property
The Home Valuation Report is an in-depth analysis detailing your home's value as well as a comparison with similar homes in the area
Home Values in the Area
Average Home Value in this Area
Purchase History
| Date | Buyer | Sale Price | Title Company |
|---|---|---|---|
| Malik Sidra | $301,500 | Attorney | |
| Arnold Selby | $241,000 | Title Concepts Llc | |
| Maldonado Guadalupe | $239,425 | Attorney |
Source: Public Records
Mortgage History
| Date | Status | Borrower | Loan Amount |
|---|---|---|---|
| Open | Malik Sidra | $296,038 | |
| Previous Owner | Arnold Selby | $219,936 | |
| Previous Owner | Maldonado Guadalupe | $247,326 |
Source: Public Records
Tax History Compared to Growth
Tax History
| Year | Tax Paid | Tax Assessment Tax Assessment Total Assessment is a certain percentage of the fair market value that is determined by local assessors to be the total taxable value of land and additions on the property. | Land | Improvement |
|---|---|---|---|---|
| 2024 | $4,308 | $322,000 | $55,000 | $267,000 |
| 2023 | $4,308 | $309,700 | $55,000 | $254,700 |
| 2022 | $3,736 | $280,900 | $50,000 | $230,900 |
| 2021 | $3,321 | $246,000 | $40,000 | $206,000 |
| 2020 | $3,212 | $237,900 | $40,000 | $197,900 |
| 2019 | $3,050 | $225,900 | $40,000 | $185,900 |
| 2018 | $3,052 | $226,800 | $40,000 | $186,800 |
| 2017 | $2,971 | $226,800 | $40,000 | $186,800 |
| 2016 | $3,043 | $226,800 | $40,000 | $186,800 |
Source: Public Records
Map
Nearby Homes
- 3494 Prices Fork Blvd
- 5117 Moreland St
- 5212 Moreland St Unit 450
- 2262 Humphreys Dr Unit 292
- 2232 Humphreys Dr
- 2210 Humphreys Dr
- 206 Rockwood Place
- 3706 Bamboo Rd
- 126 Graystone Trace
- 6701 Duck Landing Ct
- 6109 Brookwood Dr Unit B
- 5932 Bradford Dr
- 3801 Towne Point Rd
- 15 Old Church Cir
- 3705 Red Barn Rd
- 6354 Old Townpoint Rd
- 6341 Old Townpoint Rd
- MM Midlands at Legacy at Burbage Lake Way
- MM Iris at Legacy at Burbage Lake Way
- MM Longleaf at Legacy at Burbage Lake
- 3500 Prices Fork Blvd Unit 157
- 3500 Pricesfork Blvd Unit 157
- 3500 Pricesfork Blvd
- 3502 Pricesfork Blvd Unit 156
- 3502 Pricesfork Blvd
- 3498 Pricesfork Blvd Unit 158
- 3498 Pricesfork Blvd
- 3496 Pricesfork Blvd Unit 159
- 3496 Pricesfork Blvd
- 3504 Pricesfork Blvd Unit 155
- 3504 Pricesfork Blvd
- 3494 Pricesfork Blvd Unit 160
- 3494 Pricesfork Blvd
- 7110 Arrington St Unit 126
- 7110 Arrington St
- 6111 Cushing St Unit 132
- 6111 Cushing St
- 7112 Arrington St Unit 127
- 7112 Arrington St
- 6113 Cushing St Unit 133