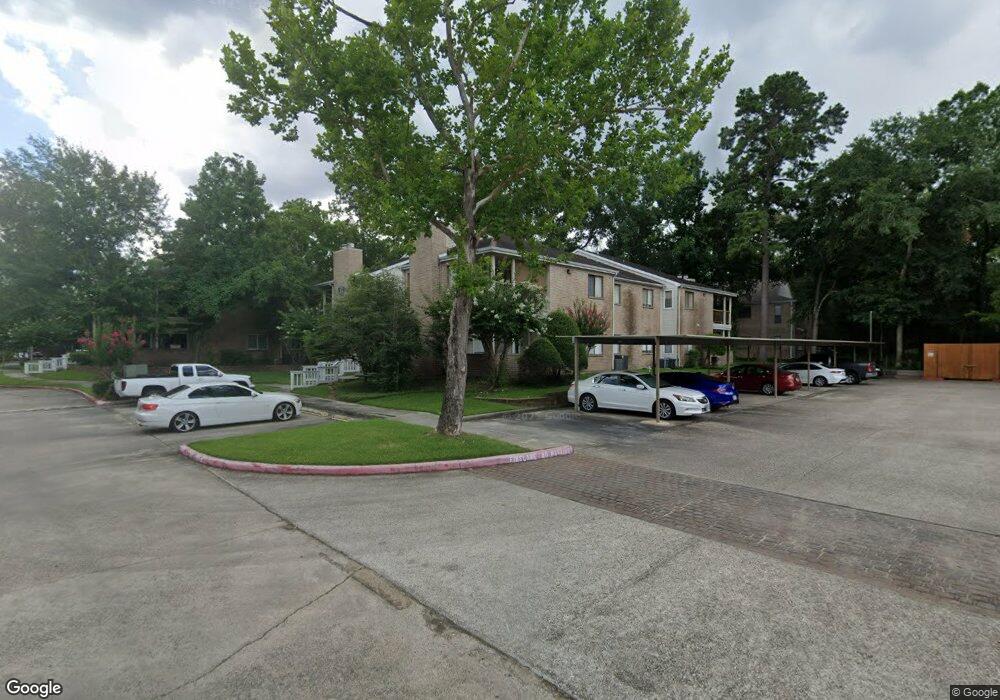
3500 Tangle Brush Dr Unit 181 Spring, TX 77381
Panther Creek NeighborhoodEstimated Value: $158,000 - $182,000
Studio
1
Bath
953
Sq Ft
$177/Sq Ft
Est. Value
About This Home
This home is located at 3500 Tangle Brush Dr Unit 181, Spring, TX 77381 and is currently estimated at $168,713, approximately $177 per square foot. 3500 Tangle Brush Dr Unit 181 is a home located in Montgomery County with nearby schools including Glen Loch Elementary School, W.D Wilkerson Intermediate School, and McCullough Junior High School.
Ownership History
Date
Name
Owned For
Owner Type
Purchase Details
Closed on
Apr 18, 2022
Sold by
Ho Kwon Sun and Hee Sang
Bought by
Depau Carlos A
Current Estimated Value
Purchase Details
Closed on
Feb 27, 2020
Sold by
Mrozik Candace G and Dodson Candace G
Bought by
Kwon Sun Ho and Kwon Sang Hee
Home Financials for this Owner
Home Financials are based on the most recent Mortgage that was taken out on this home.
Original Mortgage
$89,625
Interest Rate
3.6%
Mortgage Type
New Conventional
Purchase Details
Closed on
Nov 2, 2011
Sold by
Hunter Janet
Bought by
Dotson Candace
Purchase Details
Closed on
Nov 3, 2006
Sold by
Lawson Jeanne Smith
Bought by
Hunter Janet and Dotson Candace G
Purchase Details
Closed on
Dec 4, 1998
Sold by
Crain Mercedes C and Crain Orville Leon
Bought by
Smith Richard D and Smith Irene E
Create a Home Valuation Report for This Property
The Home Valuation Report is an in-depth analysis detailing your home's value as well as a comparison with similar homes in the area
Home Values in the Area
Average Home Value in this Area
Purchase History
| Date | Buyer | Sale Price | Title Company |
|---|---|---|---|
| Depau Carlos A | -- | Chicago Title Company | |
| Kwon Sun Ho | -- | Great American Title | |
| Dotson Candace | -- | -- | |
| Hunter Janet | -- | Vanguard Title Co | |
| Smith Richard D | -- | -- |
Source: Public Records
Mortgage History
| Date | Status | Borrower | Loan Amount |
|---|---|---|---|
| Previous Owner | Kwon Sun Ho | $89,625 |
Source: Public Records
Tax History
| Year | Tax Paid | Tax Assessment Tax Assessment Total Assessment is a certain percentage of the fair market value that is determined by local assessors to be the total taxable value of land and additions on the property. | Land | Improvement |
|---|---|---|---|---|
| 2025 | $3,241 | $173,484 | $7,000 | $166,484 |
| 2024 | $2,806 | $183,326 | $7,000 | $176,326 |
| 2023 | $2,806 | $158,030 | $7,000 | $151,030 |
| 2022 | $3,176 | $164,030 | $7,000 | $157,030 |
| 2021 | $2,770 | $132,720 | $7,000 | $125,720 |
| 2020 | $2,392 | $109,060 | $7,000 | $102,060 |
| 2019 | $2,396 | $105,710 | $7,000 | $98,710 |
| 2018 | $2,396 | $105,710 | $7,000 | $98,710 |
| 2017 | $2,469 | $105,710 | $7,000 | $98,710 |
| 2016 | $2,218 | $94,970 | $7,000 | $87,970 |
| 2015 | $1,818 | $88,180 | $7,000 | $81,180 |
| 2014 | $1,818 | $77,290 | $7,000 | $70,290 |
Source: Public Records
Map
Nearby Homes
- 3500 Tangle Brush Dr Unit 152
- 3500 Tangle Brush Dr Unit 193
- 3500 Tangle Brush Dr Unit 138
- 3500 Tangle Brush Dr Unit 178
- 3500 Tangle Brush Dr Unit 139
- 3500 Tangle Brush Dr Unit 14
- 3500 Tangle Brush Dr Unit 104
- 3500 Tangle Brush Dr Unit 194
- 3500 Tangle Brush Dr Unit 195
- 3500 Tangle Brush Dr Unit 40
- 3500 Tangle Brush Dr Unit 7
- 3500 Tangle Brush Dr Unit 200
- 3500 Tangle Brush Dr Unit 37
- 3500 Tangle Brush Dr Unit 3
- 3500 Tangle Brush Dr Unit 186
- 23 Summer Crest Cir
- 92 S Waxberry Rd
- 102 Summer Crest Cir
- 3514 Valerie Ln
- 3523 Willie Way
- 3500 Tangle Brush Dr Unit 163
- 3500 Tangle Brush Dr Unit 228
- 3500 Tangle Brush Dr Unit 227
- 3500 Tangle Brush Dr Unit 226
- 3500 Tangle Brush Dr Unit 225
- 3500 Tangle Brush Dr Unit 224
- 3500 Tangle Brush Dr Unit 223
- 3500 Tangle Brush Dr Unit 222
- 3500 Tangle Brush Dr Unit 220
- 3500 Tangle Brush Dr Unit 219
- 3500 Tangle Brush Dr Unit 218
- 3500 Tangle Brush Dr Unit 217
- 3500 Tangle Brush Dr Unit 216
- 3500 Tangle Brush Dr Unit 215
- 3500 Tangle Brush Dr Unit 214
- 3500 Tangle Brush Dr Unit 213
- 3500 Tangle Brush Dr Unit 212
- 3500 Tangle Brush Dr Unit 211
- 3500 Tangle Brush Dr Unit 210
- 3500 Tangle Brush Dr Unit 209
Your Personal Tour Guide
Ask me questions while you tour the home.