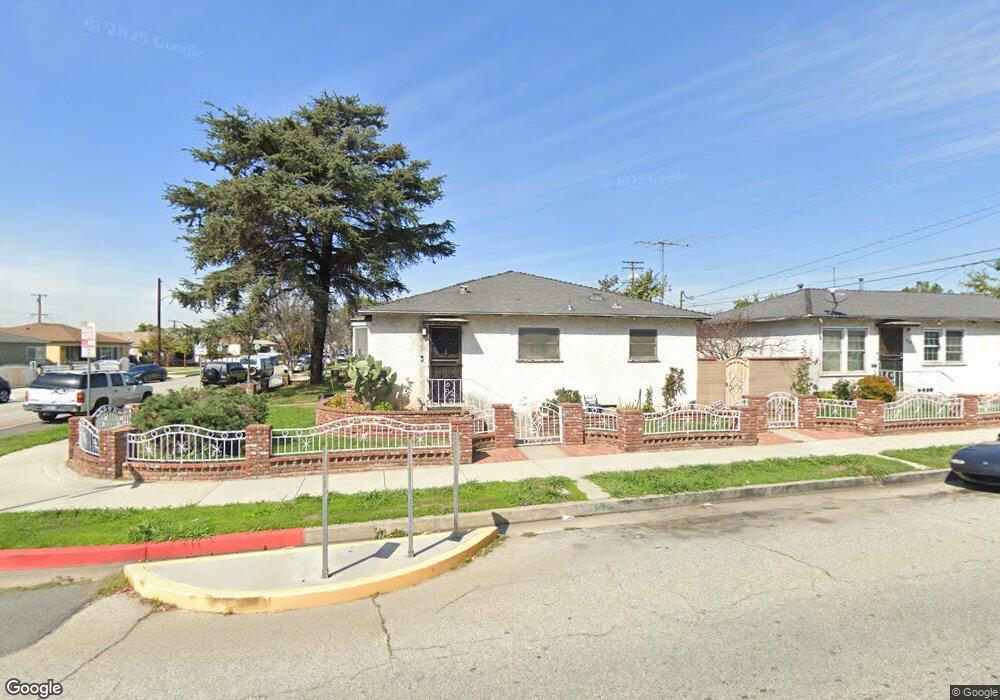
3500 W Via Corona Montebello, CA 90640
Estimated Value: $840,000 - $1,244,586
6
Beds
4
Baths
2,902
Sq Ft
$366/Sq Ft
Est. Value
About This Home
This home is located at 3500 W Via Corona, Montebello, CA 90640 and is currently estimated at $1,061,397, approximately $365 per square foot. 3500 W Via Corona is a home located in Los Angeles County with nearby schools including Joseph A. Gascon Elementary School, Macy Intermediate School, and Schurr High School.
Ownership History
Date
Name
Owned For
Owner Type
Purchase Details
Closed on
Oct 20, 2004
Sold by
Carrillo Aurelio Antonio and Decarrillo Maria Teresa Soto
Bought by
Carrillo Aurelio Antonio and Carrillo Angelique Pinedo
Current Estimated Value
Home Financials for this Owner
Home Financials are based on the most recent Mortgage that was taken out on this home.
Original Mortgage
$300,000
Outstanding Balance
$137,047
Interest Rate
5.72%
Mortgage Type
New Conventional
Estimated Equity
$924,350
Purchase Details
Closed on
Sep 20, 2000
Sold by
Sokol Dorothy A and Sokol Alexander
Bought by
Carrillo Aurelio Antonio and Carrillo Aurelio
Home Financials for this Owner
Home Financials are based on the most recent Mortgage that was taken out on this home.
Original Mortgage
$296,555
Interest Rate
7.89%
Mortgage Type
FHA
Purchase Details
Closed on
Jul 30, 1993
Sold by
Sokol Alexander and Sokol Dorothy A
Bought by
Sokol Alexander and Sokol Dorothy A
Create a Home Valuation Report for This Property
The Home Valuation Report is an in-depth analysis detailing your home's value as well as a comparison with similar homes in the area
Home Values in the Area
Average Home Value in this Area
Purchase History
| Date | Buyer | Sale Price | Title Company |
|---|---|---|---|
| Carrillo Aurelio Antonio | -- | United Title Company | |
| Carrillo Aurelio Antonio | $299,000 | Fidelity National Title | |
| Sokol Alexander | -- | -- |
Source: Public Records
Mortgage History
| Date | Status | Borrower | Loan Amount |
|---|---|---|---|
| Open | Carrillo Aurelio Antonio | $300,000 | |
| Closed | Carrillo Aurelio Antonio | $296,555 |
Source: Public Records
Tax History Compared to Growth
Tax History
| Year | Tax Paid | Tax Assessment Tax Assessment Total Assessment is a certain percentage of the fair market value that is determined by local assessors to be the total taxable value of land and additions on the property. | Land | Improvement |
|---|---|---|---|---|
| 2025 | $8,938 | $554,445 | $279,191 | $275,254 |
| 2024 | $8,938 | $543,574 | $273,717 | $269,857 |
| 2023 | $8,899 | $532,916 | $268,350 | $264,566 |
| 2022 | $8,606 | $522,468 | $263,089 | $259,379 |
| 2021 | $8,277 | $512,225 | $257,931 | $254,294 |
| 2019 | $7,899 | $497,034 | $250,282 | $246,752 |
| 2018 | $7,923 | $487,289 | $245,375 | $241,914 |
| 2016 | $7,588 | $468,369 | $235,848 | $232,521 |
| 2015 | $7,204 | $461,335 | $232,306 | $229,029 |
| 2014 | $7,121 | $452,299 | $227,756 | $224,543 |
Source: Public Records
Map
Nearby Homes
- 532 Keenan Ave
- 544 Keenan Ave
- 3413 W Beverly Blvd
- 601 Keenan Ave
- 631 Leonard Ave
- 637 Leonard St
- 668 Keenan Ave
- 413 Brady Ave
- 2963 Via San Carlo
- 545 Eastmont Ave
- 459 Eastmont Ave
- 629 Eastmont Ave
- 5505 E 6th St
- 249 Simmons Ave
- 573 Belden Ave
- 2912 W Via Acosta
- 6114 Allston St
- 833 Findlay Ave
- 3613 Via Campo
- 264 Margaret Ave
- 3504 W Via Corona
- 3508 W Via Corona
- 3505 W Beverly Blvd
- 3512 W Via Corona
- 3509 W Beverly Blvd
- 3505 W Via Corona
- 3501 W Via Corona
- 3509 W Via Corona
- 3516 W Via Corona
- 3513 W Via Corona
- 3517 W Via Corona
- 3417 W Beverly Blvd
- 3512 W Beverly Blvd
- 3520 W Via Corona
- 3415 W Beverly Blvd
- 3517 W Beverly Blvd
- 3521 W Via Corona
- 3504 W Repetto Ave
- 3500 W Repetto Ave
- 3508 W Repetto Ave