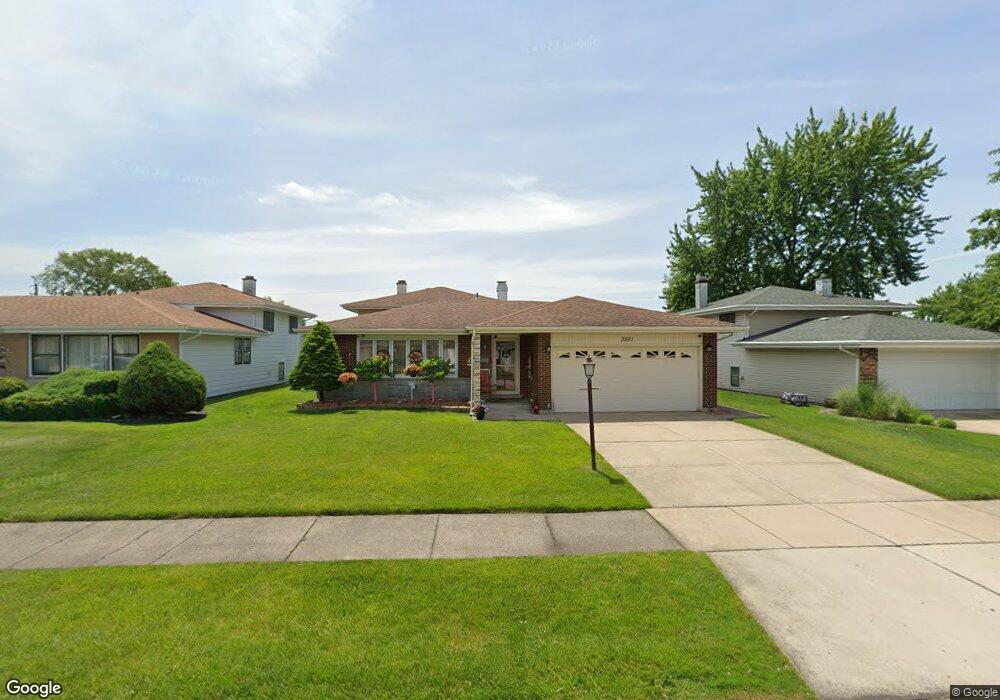
3501 191st Place Lansing, IL 60438
Estimated Value: $209,000 - $253,000
3
Beds
2
Baths
1,127
Sq Ft
$210/Sq Ft
Est. Value
About This Home
This home is located at 3501 191st Place, Lansing, IL 60438 and is currently estimated at $236,581, approximately $209 per square foot. 3501 191st Place is a home located in Cook County with nearby schools including Nathan Hale Elementary School, Heritage Middle School, and Thornton Fractnl So High School.
Ownership History
Date
Name
Owned For
Owner Type
Purchase Details
Closed on
Apr 20, 2006
Sold by
Lafayette Connie J and Jordan Connie J
Bought by
Jordan Connie J
Current Estimated Value
Home Financials for this Owner
Home Financials are based on the most recent Mortgage that was taken out on this home.
Original Mortgage
$140,000
Outstanding Balance
$88,901
Interest Rate
8.25%
Mortgage Type
Balloon
Estimated Equity
$147,680
Purchase Details
Closed on
Mar 11, 2004
Sold by
Lafayette Keith B
Bought by
Lafayette Connie J
Purchase Details
Closed on
Sep 14, 1999
Sold by
Zubowicz Paul Stanley
Bought by
Lafayette Keith B and Lafayette Connie J
Home Financials for this Owner
Home Financials are based on the most recent Mortgage that was taken out on this home.
Original Mortgage
$135,950
Interest Rate
7.83%
Mortgage Type
FHA
Create a Home Valuation Report for This Property
The Home Valuation Report is an in-depth analysis detailing your home's value as well as a comparison with similar homes in the area
Home Values in the Area
Average Home Value in this Area
Purchase History
| Date | Buyer | Sale Price | Title Company |
|---|---|---|---|
| Jordan Connie J | -- | Oconnor Title Services Inc | |
| Lafayette Connie J | -- | -- | |
| Lafayette Keith B | $137,000 | -- |
Source: Public Records
Mortgage History
| Date | Status | Borrower | Loan Amount |
|---|---|---|---|
| Open | Jordan Connie J | $140,000 | |
| Closed | Lafayette Keith B | $135,950 |
Source: Public Records
Tax History Compared to Growth
Tax History
| Year | Tax Paid | Tax Assessment Tax Assessment Total Assessment is a certain percentage of the fair market value that is determined by local assessors to be the total taxable value of land and additions on the property. | Land | Improvement |
|---|---|---|---|---|
| 2024 | $7,544 | $21,000 | $5,082 | $15,918 |
| 2023 | $6,215 | $21,000 | $5,082 | $15,918 |
| 2022 | $6,215 | $14,007 | $4,389 | $9,618 |
| 2021 | $6,041 | $14,006 | $4,389 | $9,617 |
| 2020 | $5,775 | $14,006 | $4,389 | $9,617 |
| 2019 | $5,327 | $13,732 | $3,927 | $9,805 |
| 2018 | $5,178 | $13,732 | $3,927 | $9,805 |
| 2017 | $5,099 | $13,732 | $3,927 | $9,805 |
| 2016 | $5,046 | $13,024 | $3,465 | $9,559 |
| 2015 | $4,832 | $13,024 | $3,465 | $9,559 |
| 2014 | $4,744 | $13,024 | $3,465 | $9,559 |
| 2013 | $4,897 | $14,524 | $3,465 | $11,059 |
Source: Public Records
Map
Nearby Homes
- 3542 191st Place
- 19061 Wentworth Ave
- 19202 Sherman St
- 3461 S Manor Dr
- 19265 Lange St
- 19205 Ada St
- 3363 S Manor Dr
- 3320 191st St
- 3312 192nd Place
- 3328 193rd St
- 3240 N Manor Dr Unit 130
- 18747 Sherman St
- 18855 Burnham Ave Unit 234
- 18855 Burnham Ave Unit 132
- 18855 Burnham Ave Unit 231
- 3109 190th St Unit 2
- 18864 Greenbay Ave
- 18828 Greenbay Ave
- 3034 190th St
- 3048 189th St
- 3509 191st Place
- 3461 191st Place
- 3515 191st Place
- 3455 191st Place
- 3500 192nd St
- 3456 192nd St
- 3506 192nd St
- 3521 191st Place
- 3449 191st Place
- 3512 192nd St
- 3502 191st Place
- 3508 191st Place
- 3460 191st Place
- 3514 191st Place
- 3444 192nd St
- 3518 192nd St
- 3443 191st Place
- 3525 191st Place
- 3454 191st Place