3501 Section Rd Cincinnati, OH 45237
Kennedy Heights NeighborhoodAbout This Home
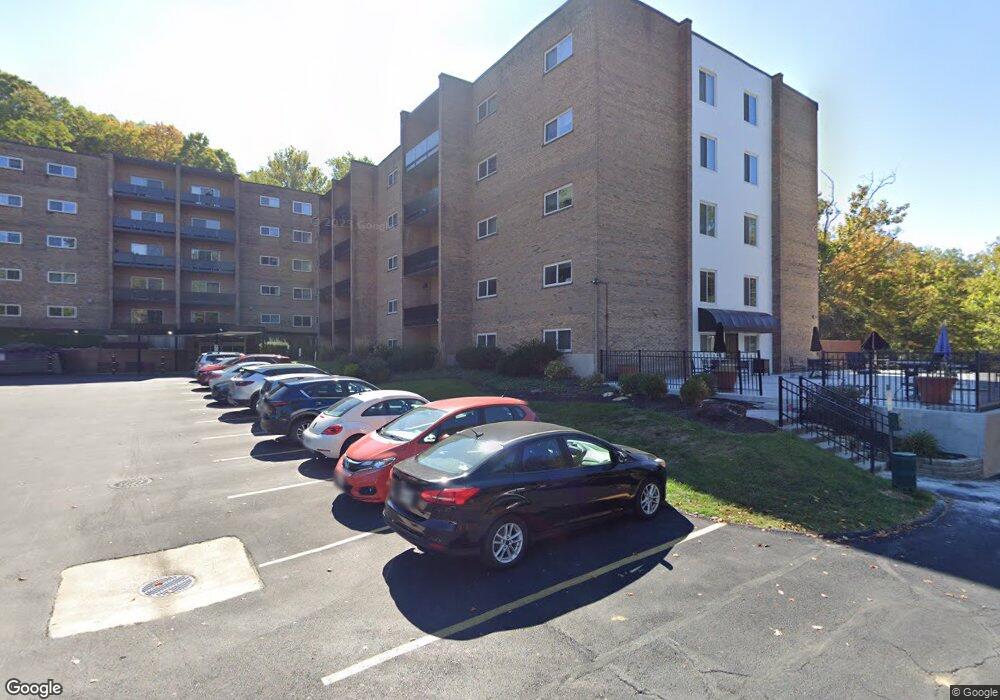
Welcome to Amberley House, a luxurious and secure apartment community located on 3501 Section Road in Cincinnati. With 72 units spread across 6 floors, this community is perfect for anyone looking for a peaceful and tranquil living experience.
Enjoy the convenience of secured entry with a key fob, a state-of-the-art gym, a community room, and breathtaking views of the surrounding area. Our newly updated apartments boast impeccable attention to detail and a refined aesthetic, featuring luxury vinyl flooring, plush carpeted bedrooms, and modernized kitchens with granite countertops and sleek stainless steel appliances.
Community amenities include an on-site gym, unit assigned complimentary storage and card-operated laundry facilities on every floor ensuring that our residents have everything they need right at their fingertips. Residents also have access to our community room space to rent for private gatherings. Residents are responsible for heat, electric, and water.
To apply, simply visit our website at and complete the application. There is an application fee per applicant for anyone 18 years or older.
Our minimum requirements include:
1. A gross income of at least three times the monthly rent rate
2. No outstanding or delinquent accounts with utility service providers.
3. A credit score of at least 575.
4. No previous evictions in the past 7 years
5. No violent felonies ever or non-violent felonies in the past 7 years
6. No sex offenders
SNS Management is an equal opportunity housing provider. Please be aware that the listing or video provided may not be an exact representation of the apartment you are interested in. However, we strive to maintain consistency throughout all of our properties.
Home Values in the Area
Average Home Value in this Area
Property History
| Date | Event | Price | List to Sale | Price per Sq Ft |
|---|---|---|---|---|
| 07/04/2025 07/04/25 | Off Market | $1,450 | -- | -- |
| 05/27/2025 05/27/25 | Price Changed | $1,450 | +10.2% | $1 / Sq Ft |
| 05/21/2025 05/21/25 | Price Changed | $1,316 | -9.2% | $1 / Sq Ft |
| 04/29/2025 04/29/25 | Price Changed | $1,450 | -9.7% | $1 / Sq Ft |
| 04/29/2025 04/29/25 | Price Changed | $1,605 | +10.7% | $1 / Sq Ft |
| 04/23/2025 04/23/25 | Price Changed | $1,450 | -9.7% | $1 / Sq Ft |
| 04/16/2025 04/16/25 | Price Changed | $1,605 | +15.1% | $1 / Sq Ft |
| 04/10/2025 04/10/25 | Price Changed | $1,395 | 0.0% | $1 / Sq Ft |
| 01/16/2025 01/16/25 | Price Changed | $1,395 | -2.8% | $1 / Sq Ft |
| 12/26/2024 12/26/24 | Price Changed | $1,435 | 0.0% | $1 / Sq Ft |
| 12/26/2024 12/26/24 | For Rent | $1,435 | -9.7% | -- |
| 03/18/2024 03/18/24 | Price Changed | $1,590 | +12.8% | $1 / Sq Ft |
| 01/11/2024 01/11/24 | Price Changed | $1,410 | +38.9% | $1 / Sq Ft |
| 01/03/2024 01/03/24 | Price Changed | $1,015 | -27.2% | $1 / Sq Ft |
| 12/19/2023 12/19/23 | Price Changed | $1,395 | -1.1% | $1 / Sq Ft |
| 12/13/2023 12/13/23 | Price Changed | $1,410 | -11.9% | $1 / Sq Ft |
| 12/06/2023 12/06/23 | Price Changed | $1,600 | +26.0% | $1 / Sq Ft |
| 11/21/2023 11/21/23 | Price Changed | $1,270 | +42.7% | $1 / Sq Ft |
| 11/14/2023 11/14/23 | Price Changed | $890 | -29.9% | $0 / Sq Ft |
| 10/17/2023 10/17/23 | Price Changed | $1,270 | -35.5% | $1 / Sq Ft |
| 10/11/2023 10/11/23 | Price Changed | $1,970 | +23.1% | $1 / Sq Ft |
| 10/06/2023 10/06/23 | Price Changed | $1,600 | +13.5% | $1 / Sq Ft |
| 10/05/2023 10/05/23 | Price Changed | $1,410 | -11.9% | $1 / Sq Ft |
| 10/01/2023 10/01/23 | Price Changed | $1,600 | +0.3% | $1 / Sq Ft |
| 09/06/2023 09/06/23 | Price Changed | $1,595 | -18.6% | $1 / Sq Ft |
| 08/26/2023 08/26/23 | Price Changed | $1,960 | +40.5% | $1 / Sq Ft |
| 08/25/2023 08/25/23 | Price Changed | $1,395 | +7.3% | $1 / Sq Ft |
| 08/11/2023 08/11/23 | Price Changed | $1,300 | -6.8% | $1 / Sq Ft |
| 08/08/2023 08/08/23 | For Rent | $1,395 | 0.0% | -- |
| 07/24/2023 07/24/23 | Price Changed | $1,395 | +7.3% | $1 / Sq Ft |
| 07/11/2023 07/11/23 | Price Changed | $1,300 | -6.8% | $1 / Sq Ft |
| 06/26/2023 06/26/23 | Price Changed | $1,395 | 0.0% | $1 / Sq Ft |
| 06/24/2023 06/24/23 | Price Changed | $1,395 | 0.0% | $1 / Sq Ft |
| 06/21/2023 06/21/23 | For Rent | $1,395 | 0.0% | -- |
| 06/14/2023 06/14/23 | For Rent | $1,395 | -3.8% | -- |
| 06/09/2023 06/09/23 | For Rent | $1,450 | +3.9% | -- |
| 05/20/2023 05/20/23 | Price Changed | $1,395 | -- | $1 / Sq Ft |
Tax History
| Year | Tax Paid | Tax Assessment Tax Assessment Total Assessment is a certain percentage of the fair market value that is determined by local assessors to be the total taxable value of land and additions on the property. | Land | Improvement |
|---|---|---|---|---|
| 2025 | $99,091 | $1,194,760 | $134,876 | $1,059,884 |
| 2024 | $98,428 | $1,194,760 | $134,876 | $1,059,884 |
| 2023 | $98,176 | $1,194,760 | $134,876 | $1,059,884 |
| 2022 | $90,634 | $999,471 | $127,848 | $871,623 |
| 2021 | $89,023 | $1,046,210 | $127,848 | $918,362 |
| 2020 | $93,286 | $1,046,210 | $127,848 | $918,362 |
| 2019 | $92,658 | $959,826 | $117,292 | $842,534 |
| 2018 | $92,705 | $959,826 | $117,292 | $842,534 |
| 2017 | $89,786 | $959,826 | $117,292 | $842,534 |
| 2016 | $96,880 | $1,014,850 | $123,456 | $891,394 |
| 2015 | $89,007 | $1,014,850 | $123,456 | $891,394 |
| 2014 | $89,308 | $1,014,850 | $123,456 | $891,394 |
| 2013 | $89,560 | $1,014,850 | $123,456 | $891,394 |
Map
- 3521 Section Rd
- 3533 Amberacres Dr
- 3563 Amberacres Dr
- 6470 Crestview Ave
- 6454 Crestview Ave
- 6466 Crestview Ave
- 6462 Crestview Ave
- 6458 Crestview Ave
- 6460 Mchugh Place
- 3814 N Broadlawn Cir
- 6508 Coleridge Ave
- 6501 Coleridge Ave
- 3523 Mary Ann Ln
- 6256 Rogers Park Place
- 3625 Zinsle Ave
- 3911 E Gatewood Ln
- 7651 Sagamore Dr
- 6829 Alpine Ave
- 6276 Grand Vista Ave
- 6207 Coleridge Ave
- 3515 Section Rd
- 3515 Section Rd
- 3515 Section Rd Unit 2
- 3521 Section Rd Unit 4
- 3521 Section Rd Unit 3
- 3521 Section Rd Unit 2
- 3521 Section Rd Unit 1
- 3529 Section Rd Unit 3
- 3529 Section Rd
- 3529 Section Rd
- 3529 Section Rd Unit 1
- 3529 Section Rd Unit 2
- 3529 Section Rd Unit 4
- 3483 Section Rd
- 3530 Section Rd
- 3469 Section Rd
- 3545 Section Rd Unit 1E
- 3545 Section Rd
- 3545 Section Rd
- 3545 Section Rd
Ask me questions while you tour the home.