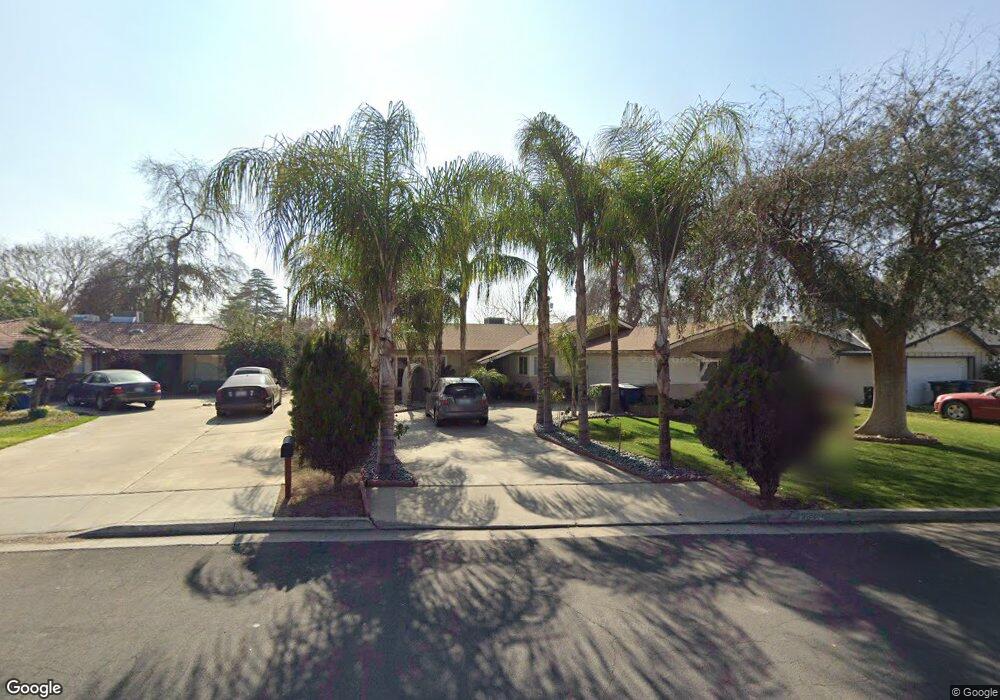
3501 Squire Ln Bakersfield, CA 93309
Southwest Bakersfield NeighborhoodEstimated Value: $332,000 - $376,000
3
Beds
2
Baths
1,810
Sq Ft
$195/Sq Ft
Est. Value
About This Home
This home is located at 3501 Squire Ln, Bakersfield, CA 93309 and is currently estimated at $353,133, approximately $195 per square foot. 3501 Squire Ln is a home located in Kern County with nearby schools including Munsey Elementary School, Curran Middle School, and West High School.
Ownership History
Date
Name
Owned For
Owner Type
Purchase Details
Closed on
Jan 12, 2010
Sold by
Demejia Angelica T Ramirez
Bought by
Ramirez Rene G Mejia
Current Estimated Value
Home Financials for this Owner
Home Financials are based on the most recent Mortgage that was taken out on this home.
Original Mortgage
$154,646
Outstanding Balance
$100,134
Interest Rate
4.68%
Mortgage Type
FHA
Estimated Equity
$252,999
Purchase Details
Closed on
Dec 29, 2009
Sold by
Mckay David N and Mckay Virginia L
Bought by
Ramirez Rene G Mejia
Home Financials for this Owner
Home Financials are based on the most recent Mortgage that was taken out on this home.
Original Mortgage
$154,646
Outstanding Balance
$100,134
Interest Rate
4.68%
Mortgage Type
FHA
Estimated Equity
$252,999
Purchase Details
Closed on
Sep 10, 2009
Sold by
Clark Casey Lee and Olson Terrance
Bought by
Mckay David N and Mckay Virginia L
Purchase Details
Closed on
Oct 10, 2006
Sold by
Clark Raymond L and Clark Bobbie J
Bought by
Clark Ray L and The Ray & Bobbie Clark 2006 Re
Create a Home Valuation Report for This Property
The Home Valuation Report is an in-depth analysis detailing your home's value as well as a comparison with similar homes in the area
Home Values in the Area
Average Home Value in this Area
Purchase History
| Date | Buyer | Sale Price | Title Company |
|---|---|---|---|
| Ramirez Rene G Mejia | -- | Placer Title Company | |
| Ramirez Rene G Mejia | $157,500 | Placer Title Company | |
| Mckay David N | $100,000 | Placer Title Company | |
| Clark Ray L | -- | None Available |
Source: Public Records
Mortgage History
| Date | Status | Borrower | Loan Amount |
|---|---|---|---|
| Open | Ramirez Rene G Mejia | $154,646 |
Source: Public Records
Tax History Compared to Growth
Tax History
| Year | Tax Paid | Tax Assessment Tax Assessment Total Assessment is a certain percentage of the fair market value that is determined by local assessors to be the total taxable value of land and additions on the property. | Land | Improvement |
|---|---|---|---|---|
| 2025 | $2,844 | $203,935 | $51,627 | $152,308 |
| 2024 | $2,844 | $199,937 | $50,615 | $149,322 |
| 2023 | $2,771 | $196,018 | $49,623 | $146,395 |
| 2022 | $2,681 | $192,175 | $48,650 | $143,525 |
| 2021 | $2,582 | $188,408 | $47,697 | $140,711 |
| 2020 | $2,537 | $186,477 | $47,208 | $139,269 |
| 2019 | $2,484 | $186,477 | $47,208 | $139,269 |
| 2018 | $2,410 | $179,238 | $45,376 | $133,862 |
| 2017 | $2,394 | $175,725 | $44,487 | $131,238 |
| 2016 | $2,183 | $172,280 | $43,615 | $128,665 |
| 2015 | $2,179 | $169,693 | $42,960 | $126,733 |
| 2014 | $2,112 | $166,370 | $42,119 | $124,251 |
Source: Public Records
Map
Nearby Homes
- 3401 Squire Ln
- 4016 Granada Ave
- 4117 Erin Ct
- 992 Delfino Ln
- 1901 S Real Rd
- 4428 Belle Terrace
- 3912 Soranno Ave
- 1101 Castro Ln
- 420 S Real Rd
- 3808 Navajo Ave
- 3605 Ora Vista Ave
- 705 Stephens Dr
- 615 Cherokee Dr
- 4317 Parkwood Ct
- 3920 Navajo Ave
- 717 Castro Ln
- 3720 Apache Ave
- 3820 Apache Ave
- 705 Castro Ln
- 531 Stephens Dr
- 3413 Squire Ln
- 3507 Squire Ln
- 3409 Squire Ln
- 3504 Laverne Ave
- 3508 Laverne Ave
- 3511 Squire Ln
- 3500 Laverne Ave
- 3512 Laverne Ave
- 3407 Squire Ln
- 3416 Laverne Ave
- 3600 Laverne Ave
- 3412 Laverne Ave
- 3607 Squire Ln
- 3414 Squire Ln
- 3502 Squire Ln
- 3403 Squire Ln
- 3410 Squire Ln
- 3508 Squire Ln
- 3408 Laverne Ave