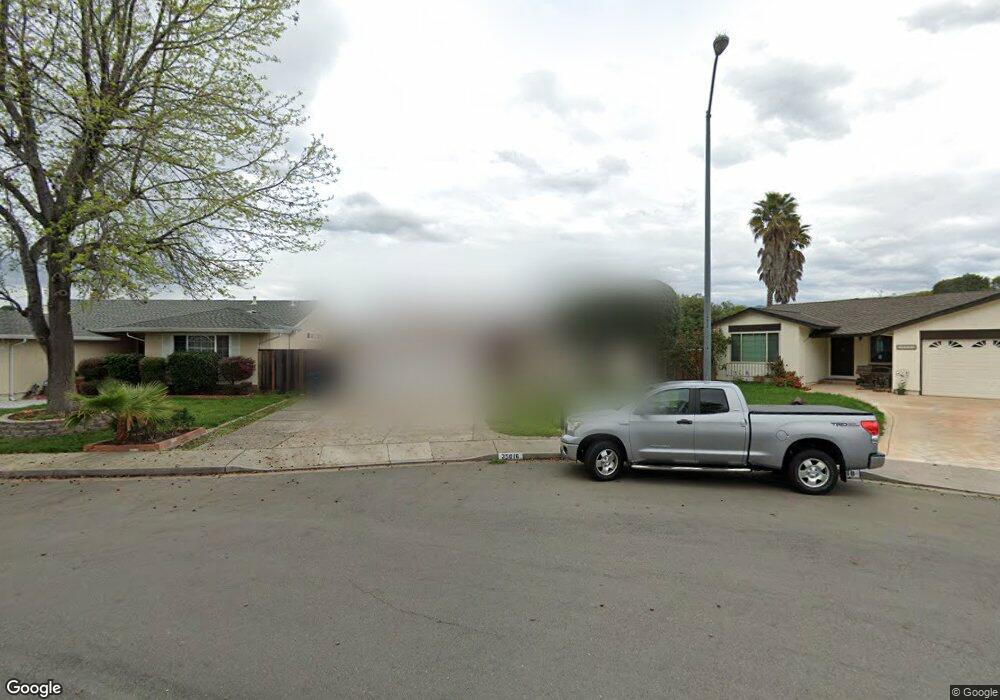
35016 Lilac Loop Union City, CA 94587
Downtown Union City NeighborhoodEstimated Value: $1,344,000 - $1,518,902
4
Beds
3
Baths
1,869
Sq Ft
$785/Sq Ft
Est. Value
About This Home
This home is located at 35016 Lilac Loop, Union City, CA 94587 and is currently estimated at $1,467,726, approximately $785 per square foot. 35016 Lilac Loop is a home located in Alameda County with nearby schools including Searles Elementary School, Cesar Chavez Middle School, and James Logan High School.
Ownership History
Date
Name
Owned For
Owner Type
Purchase Details
Closed on
Oct 7, 2011
Sold by
Warraich Kuldip S and Warraich Kuldip K
Bought by
Singh Kuldip and Warraich Kuldip K
Current Estimated Value
Purchase Details
Closed on
Jan 18, 2000
Sold by
Guerrero Vaughn F and Guerrero Cynthia D
Bought by
Warraich Kuldip S and Warraich Kuldip K
Home Financials for this Owner
Home Financials are based on the most recent Mortgage that was taken out on this home.
Original Mortgage
$280,000
Interest Rate
8.26%
Create a Home Valuation Report for This Property
The Home Valuation Report is an in-depth analysis detailing your home's value as well as a comparison with similar homes in the area
Home Values in the Area
Average Home Value in this Area
Purchase History
| Date | Buyer | Sale Price | Title Company |
|---|---|---|---|
| Singh Kuldip | -- | None Available | |
| Warraich Kuldip S | $350,000 | First American Title Guarant |
Source: Public Records
Mortgage History
| Date | Status | Borrower | Loan Amount |
|---|---|---|---|
| Previous Owner | Warraich Kuldip S | $280,000 |
Source: Public Records
Tax History
| Year | Tax Paid | Tax Assessment Tax Assessment Total Assessment is a certain percentage of the fair market value that is determined by local assessors to be the total taxable value of land and additions on the property. | Land | Improvement |
|---|---|---|---|---|
| 2025 | $8,392 | $559,345 | $161,373 | $404,972 |
| 2024 | $8,392 | $548,242 | $158,209 | $397,033 |
| 2023 | $8,109 | $544,357 | $155,108 | $389,249 |
| 2022 | $7,959 | $526,685 | $152,067 | $381,618 |
| 2021 | $7,780 | $516,223 | $149,086 | $374,137 |
| 2020 | $7,635 | $517,861 | $147,558 | $370,303 |
| 2019 | $7,703 | $507,708 | $144,665 | $363,043 |
| 2018 | $7,523 | $497,755 | $141,829 | $355,926 |
| 2017 | $7,342 | $487,998 | $139,049 | $348,949 |
| 2016 | $7,076 | $478,431 | $136,323 | $342,108 |
| 2015 | $6,940 | $471,246 | $134,276 | $336,970 |
| 2014 | $6,680 | $462,014 | $131,645 | $330,369 |
Source: Public Records
Map
Nearby Homes
- 2102 Farrol Ave
- 34839 Clover St
- 34819 Clover St
- 35037 Begonia St
- 2203 Peacock Place Unit 1
- 2201 Partridge Way Unit 2
- 2921 Daisy Ct
- 35530 Monterra Terrace Unit 303
- 34926 Moina Shaiq Common
- 2446 Bing Place
- 2636 Rainier Ct
- 810 Saltillo Place
- 3179 Mackenzie Place
- 35630 Woodbridge Place
- 690 Kraftile Ct
- 3264 Mackenzie Place
- 34246 Arizona St Unit 20
- 2868 Huxley Place
- 2612 Nevada St
- 116 Mahogany Ln
- 35014 Lilac Loop
- 35018 Lilac Loop
- 35183 Garcia St
- 35199 Garcia St
- 35167 Garcia St
- 35012 Lilac Loop
- 35020 Lilac Loop
- 35215 Garcia St
- 35151 Garcia St
- 35022 Lilac Loop
- 35015 Lilac Loop
- 35010 Lilac Loop
- 2413 Farrol Ct
- 35013 Lilac Loop
- 2417 Farrol Ct
- 35231 Garcia St
- 35135 Garcia St
- 35024 Lilac Loop
- 35008 Lilac Loop
- 35011 Lilac Loop
Your Personal Tour Guide
Ask me questions while you tour the home.