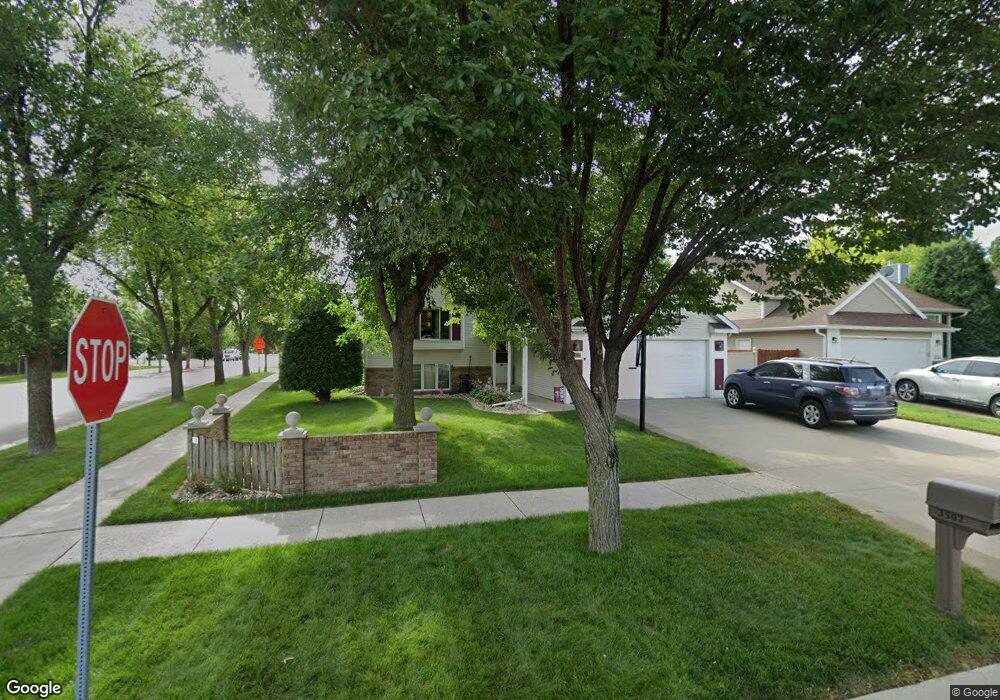
3502 19th St S Fargo, ND 58104
Southpointe NeighborhoodEstimated Value: $305,000 - $344,000
4
Beds
2
Baths
2,100
Sq Ft
$154/Sq Ft
Est. Value
About This Home
This home is located at 3502 19th St S, Fargo, ND 58104 and is currently estimated at $324,378, approximately $154 per square foot. 3502 19th St S is a home located in Cass County with nearby schools including Eagles Elementary School, Discovery Middle School, and Fargo Davies High School.
Ownership History
Date
Name
Owned For
Owner Type
Purchase Details
Closed on
Oct 20, 2011
Sold by
Theisen Matthew Todd and Theisen Tanja Anna
Bought by
Schmidt Ryan A and Schmidt Brandy L
Current Estimated Value
Home Financials for this Owner
Home Financials are based on the most recent Mortgage that was taken out on this home.
Original Mortgage
$126,400
Outstanding Balance
$86,293
Interest Rate
4.12%
Mortgage Type
New Conventional
Estimated Equity
$238,085
Purchase Details
Closed on
Aug 11, 2006
Sold by
Taylor Gregory B and Taylor Christie Jo
Bought by
Theisen Matthew Todd
Home Financials for this Owner
Home Financials are based on the most recent Mortgage that was taken out on this home.
Original Mortgage
$156,450
Interest Rate
6.7%
Mortgage Type
FHA
Create a Home Valuation Report for This Property
The Home Valuation Report is an in-depth analysis detailing your home's value as well as a comparison with similar homes in the area
Home Values in the Area
Average Home Value in this Area
Purchase History
| Date | Buyer | Sale Price | Title Company |
|---|---|---|---|
| Schmidt Ryan A | -- | Us Title & Closing | |
| Theisen Matthew Todd | -- | -- |
Source: Public Records
Mortgage History
| Date | Status | Borrower | Loan Amount |
|---|---|---|---|
| Open | Schmidt Ryan A | $126,400 | |
| Previous Owner | Theisen Matthew Todd | $156,450 |
Source: Public Records
Tax History
| Year | Tax Paid | Tax Assessment Tax Assessment Total Assessment is a certain percentage of the fair market value that is determined by local assessors to be the total taxable value of land and additions on the property. | Land | Improvement |
|---|---|---|---|---|
| 2024 | $3,303 | $141,700 | $23,700 | $118,000 |
| 2023 | $3,783 | $141,700 | $23,700 | $118,000 |
| 2022 | $3,393 | $125,050 | $25,700 | $99,350 |
| 2021 | $3,029 | $113,700 | $25,700 | $88,000 |
| 2020 | $2,717 | $103,350 | $25,700 | $77,650 |
| 2019 | $2,849 | $103,350 | $15,250 | $88,100 |
| 2018 | $2,814 | $103,350 | $15,250 | $88,100 |
| 2017 | $2,776 | $103,350 | $15,250 | $88,100 |
| 2016 | $2,248 | $90,300 | $15,250 | $75,050 |
| 2015 | $2,184 | $82,100 | $10,450 | $71,650 |
| 2014 | $2,237 | $82,100 | $10,450 | $71,650 |
| 2013 | $1,930 | $73,700 | $10,450 | $63,250 |
Source: Public Records
Map
Nearby Homes
- 3474 18th St S
- 3327 19th St S
- 1625 35th Ave S
- 1620 36 1 2 Ave S
- 3111 22nd St S
- 2606 33rd Ave S
- 3801 22nd St S
- 3025 18th St S
- 3053 22nd St S
- 3064 23rd St S
- 2629 35th Ave S Unit 306
- 2705 35th Ave S Unit 202
- 3628 28th St S
- 2330 30th Ave S
- 2332 30th Ave S
- 2336 30th Ave S
- 2338 30th Ave S
- 2825 35 1 2 Ave S
- 3401 28th St S Unit 102
- 3608 Kennedy St S
Your Personal Tour Guide
Ask me questions while you tour the home.