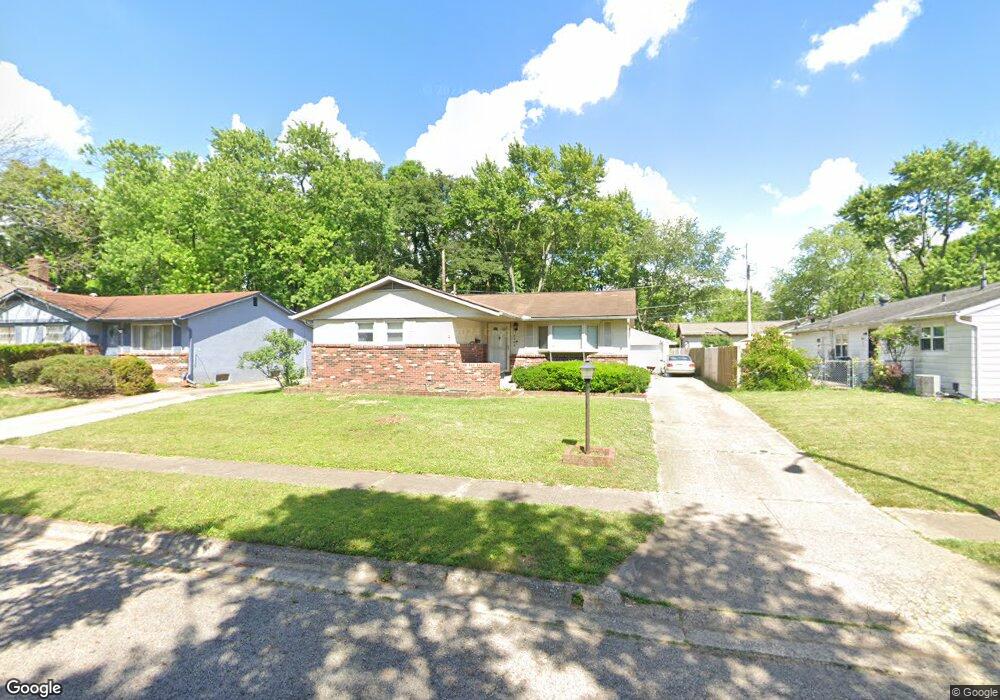
3502 Funston Place Columbus, OH 43232
East Columbus-White Ash NeighborhoodEstimated Value: $206,000 - $226,000
3
Beds
2
Baths
1,103
Sq Ft
$193/Sq Ft
Est. Value
About This Home
This home is located at 3502 Funston Place, Columbus, OH 43232 and is currently estimated at $213,303, approximately $193 per square foot. 3502 Funston Place is a home located in Franklin County with nearby schools including Groveport Madison High School, Eastland Preparatory Academy, and Zenith Academy East.
Ownership History
Date
Name
Owned For
Owner Type
Purchase Details
Closed on
Aug 2, 2015
Sold by
Mangus John T
Bought by
Mangus Tonia Y
Current Estimated Value
Purchase Details
Closed on
Jun 4, 2010
Sold by
Isaacs Margaret Elaine
Bought by
Mangus Tonia Y
Home Financials for this Owner
Home Financials are based on the most recent Mortgage that was taken out on this home.
Original Mortgage
$91,616
Outstanding Balance
$62,975
Interest Rate
5.5%
Mortgage Type
FHA
Estimated Equity
$150,328
Purchase Details
Closed on
Apr 19, 1994
Bought by
Shipley Richard R
Purchase Details
Closed on
Jun 1, 1986
Purchase Details
Closed on
Feb 1, 1980
Create a Home Valuation Report for This Property
The Home Valuation Report is an in-depth analysis detailing your home's value as well as a comparison with similar homes in the area
Home Values in the Area
Average Home Value in this Area
Purchase History
| Date | Buyer | Sale Price | Title Company |
|---|---|---|---|
| Mangus Tonia Y | -- | Attorney | |
| Mangus Tonia Y | $92,900 | Attorney | |
| Shipley Richard R | $75,900 | -- | |
| -- | -- | -- | |
| -- | $51,900 | -- |
Source: Public Records
Mortgage History
| Date | Status | Borrower | Loan Amount |
|---|---|---|---|
| Open | Mangus Tonia Y | $91,616 |
Source: Public Records
Tax History Compared to Growth
Tax History
| Year | Tax Paid | Tax Assessment Tax Assessment Total Assessment is a certain percentage of the fair market value that is determined by local assessors to be the total taxable value of land and additions on the property. | Land | Improvement |
|---|---|---|---|---|
| 2024 | $3,113 | $64,340 | $14,180 | $50,160 |
| 2023 | $3,091 | $64,330 | $14,175 | $50,155 |
| 2022 | $1,933 | $31,890 | $6,300 | $25,590 |
| 2021 | $1,976 | $31,890 | $6,300 | $25,590 |
| 2020 | $1,981 | $31,890 | $6,300 | $25,590 |
| 2019 | $1,851 | $26,180 | $5,250 | $20,930 |
| 2018 | $1,946 | $26,180 | $5,250 | $20,930 |
| 2017 | $1,951 | $26,180 | $5,250 | $20,930 |
| 2016 | $2,029 | $25,800 | $5,110 | $20,690 |
| 2015 | $2,031 | $25,800 | $5,110 | $20,690 |
| 2014 | $1,868 | $25,800 | $5,110 | $20,690 |
| 2013 | $904 | $28,665 | $5,670 | $22,995 |
Source: Public Records
Map
Nearby Homes
- 4655 Glengate Dr
- 4940 Brewster Dr
- 5004 Bentler Dr
- 5044 Albany Dr
- 4496 Reinbeau Dr
- 3721 Aurelia Dr
- 4468 Reinbeau Dr
- 3496 Cadell Rd
- 3567 Wymore Place
- 5106 Harbor Blvd
- 3900 Noe Bixby Rd
- 3493 Tremaine Rd
- 4521 Helen Dr
- 5096 Fullerton Dr
- 3856 Crestfield Dr Unit 3856
- 4485 Helen Dr
- 4486 Helen Dr
- 5145 Fullerton Dr
- 5174 Fullerton Dr
- 4479 Gerling Blvd
- 3494 Funston Place
- 4774 Funston Ct
- 4782 Funston Ct
- 3486 Funston Place
- 4790 Funston Ct
- 3501 Funston Place
- 4748 Funston Ct
- 3493 Funston Place
- 3485 Funston Place
- 4773 Funston Ct
- 4765 Funston Ct
- 4798 Funston Ct
- 4781 Funston Ct
- 4757 Funston Ct
- 3464 Funston Place
- 3475 Funston Place
- 4789 Funston Ct
- 4749 Funston Ct
- 3513 Noe Bixby Rd