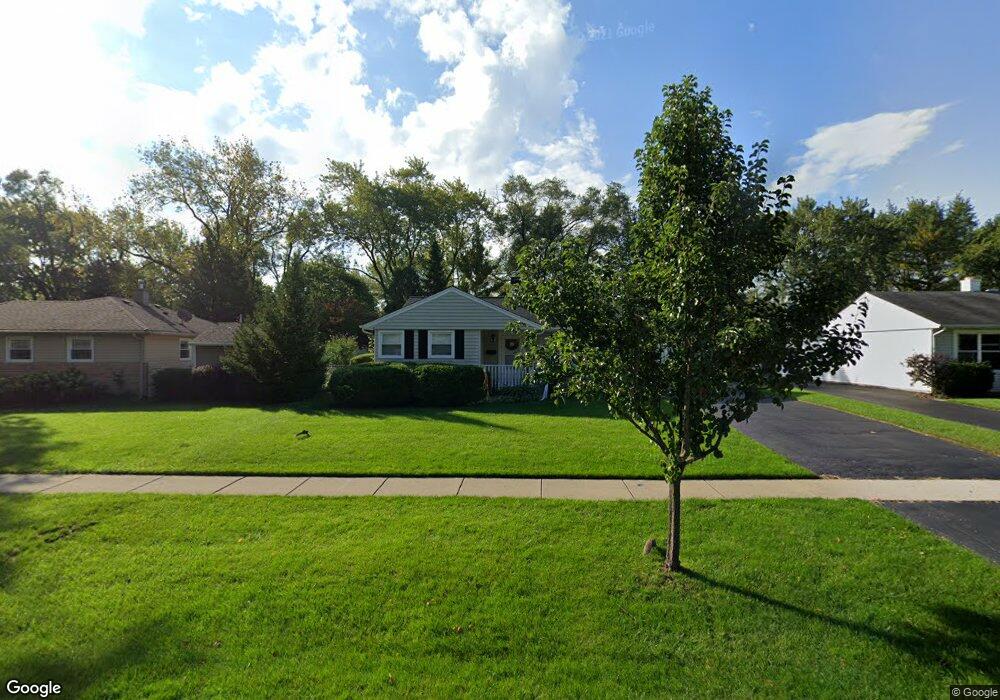
3502 Sigwalt St Rolling Meadows, IL 60008
Estimated Value: $371,000 - $399,000
4
Beds
3
Baths
1,511
Sq Ft
$254/Sq Ft
Est. Value
About This Home
This home is located at 3502 Sigwalt St, Rolling Meadows, IL 60008 and is currently estimated at $383,856, approximately $254 per square foot. 3502 Sigwalt St is a home located in Cook County with nearby schools including Kimball Hill Elementary School, King Elementary School, and Carl Sandburg Junior High School.
Ownership History
Date
Name
Owned For
Owner Type
Purchase Details
Closed on
Apr 5, 2005
Sold by
Lasalle Bank Na
Bought by
Lund Debra L
Current Estimated Value
Home Financials for this Owner
Home Financials are based on the most recent Mortgage that was taken out on this home.
Original Mortgage
$180,000
Outstanding Balance
$93,550
Interest Rate
5.89%
Mortgage Type
Fannie Mae Freddie Mac
Estimated Equity
$290,306
Create a Home Valuation Report for This Property
The Home Valuation Report is an in-depth analysis detailing your home's value as well as a comparison with similar homes in the area
Home Values in the Area
Average Home Value in this Area
Purchase History
| Date | Buyer | Sale Price | Title Company |
|---|---|---|---|
| Lund Debra L | $280,000 | 1St American Title |
Source: Public Records
Mortgage History
| Date | Status | Borrower | Loan Amount |
|---|---|---|---|
| Open | Lund Debra L | $180,000 | |
| Closed | Lund Debra L | $70,000 |
Source: Public Records
Tax History Compared to Growth
Tax History
| Year | Tax Paid | Tax Assessment Tax Assessment Total Assessment is a certain percentage of the fair market value that is determined by local assessors to be the total taxable value of land and additions on the property. | Land | Improvement |
|---|---|---|---|---|
| 2024 | $7,565 | $28,000 | $5,318 | $22,682 |
| 2023 | $7,214 | $28,000 | $5,318 | $22,682 |
| 2022 | $7,214 | $28,000 | $5,318 | $22,682 |
| 2021 | $5,202 | $19,040 | $3,142 | $15,898 |
| 2020 | $5,154 | $19,040 | $3,142 | $15,898 |
| 2019 | $5,192 | $21,274 | $3,142 | $18,132 |
| 2018 | $6,252 | $22,739 | $2,900 | $19,839 |
| 2017 | $6,144 | $22,739 | $2,900 | $19,839 |
| 2016 | $6,640 | $24,961 | $2,900 | $22,061 |
| 2015 | $5,016 | $18,554 | $2,658 | $15,896 |
| 2014 | $4,913 | $18,554 | $2,658 | $15,896 |
| 2013 | $5,396 | $20,618 | $2,658 | $17,960 |
Source: Public Records
Map
Nearby Homes
- 3400 Wellington Ct Unit 306
- 3805 Fairfax Ave
- 3265 Kirchoff Rd Unit 223
- 2401 Rohlwing Rd
- 3275 Kirchoff Rd Unit 337
- 3355 Kirchoff Rd Unit 6A
- 3125 Town Square Dr Unit 408
- 1 Foxcroft on Auburn
- 2611 South St
- 2600 Brookwood Way Dr Unit 316
- 2600 Brookwood Way Dr Unit 305
- 2600 Brookwood Way Dr Unit 214
- 2600 Brookwood Unit 314
- 2600 Brookwood Way Dr Unit 212
- 3316 Trillium Cir
- 3600 Owl Dr
- 3208 Wren Ln
- 4301 Euclid Ave
- 2041 Vermont St
- 160 E Forest Ln